We are now halfway through 2026 and the market continues to throw curveballs! If you had asked me how things would play out in Quarter 2 based on the available information from the beginning of the year, I would be painting a wildly different picture. This is why we don’t make predictions.
There were so many external factors that influenced the markets in Quarter 2. First, our uncooperative winter, which saw our local ski resorts close weeks early. This impacted tourism and, by association, real estate. The period after the ski resorts close and post-graduation is typically referred to as “mud-season” locally, and ours started a few weeks early this year. Second, the Iran conflict. Volatility in consumables and the equity markets creates reverberations felt in the real estate market. As gas prices began to rise at a quickened pace, the equity markets reacted to each new development with a hairpin trigger. The bond market erased all of the gains the mortgage interest rates had made over the previous 6 to 9 months, reducing buyer affordability, and uncertainty created a pause across the board.
I say all of this up front, not as a messenger of doom and gloom, but to provide context for the information below. It is important to understand what was happening during this period to help explain market activity.
Given that backdrop, the quarterly numbers are not too surprising, with the exception of new listings.
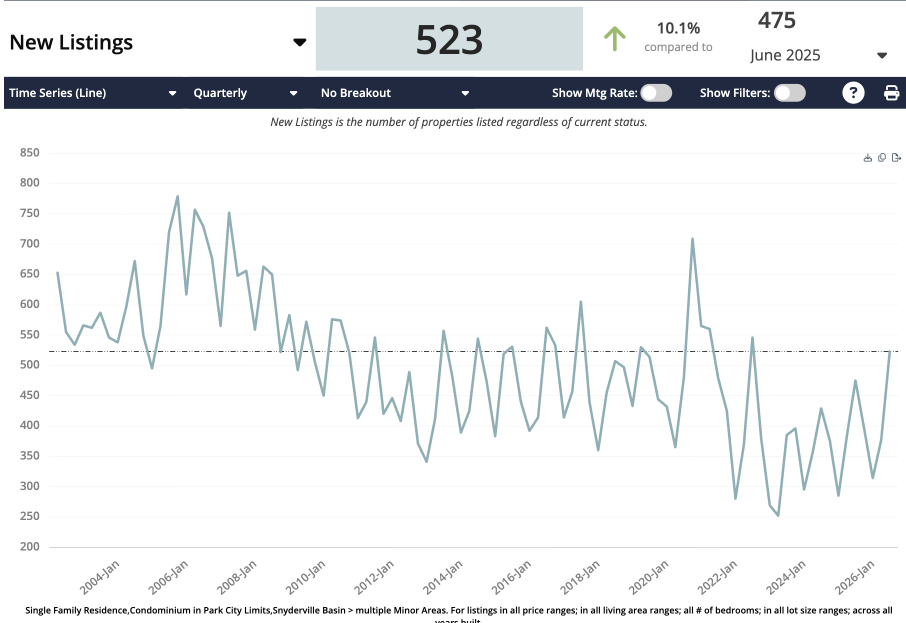
This was the largest quarter for new listings in 4 years since the peak of the Covid-fueled market. Looking at it closer, June carried the majority of those new listings, making it the busiest month for new listings in 6 years and one of the busiest in the last decade. My theory is that many sellers who would have listed earlier were advised to wait for the summer market, as “mud season” was so slow. It isn’t something I can necessarily quantify or find a causal link to, but with April and May having lower listings than typical, I think it is a fair hypothesis.
Total Park City Market, All Property Types
- Median Sales Price: $2.050m, up 1.7% year-over-year, down 8.4% quarter-over-quarter
- Average Sales Price: $3.116m, down 1.5% year-over-year, down 9.6% quarter-over-quarter
- Sold Properties: 213, down 4.9% year-over-year, up 8.1% quarter-over-quarter
- Sold Dollar Volume: $657m, down 6% year-over-year, down 1.7% quarter-over-quarter
- New Listings: 523, up 10.1% year-over-year, up 38.7% quarter-over-quarter
- Under Contract Properties: 222, up 4.2% year-over-year, down 5.9% quarter-over-quarter
- Total Active Inventory: 615, up 2.2% year-over-year
These numbers are not entirely surprising given the contextual backdrop. The good news is that pending sales were still on pace year-over-year, while growing inventory gives consumers more choices as they search for properties. Overall, the inventory picture continues to climb over the years. But fewer cash buyers, combined with higher interest rates and reduced affordability, are dragging down sales.
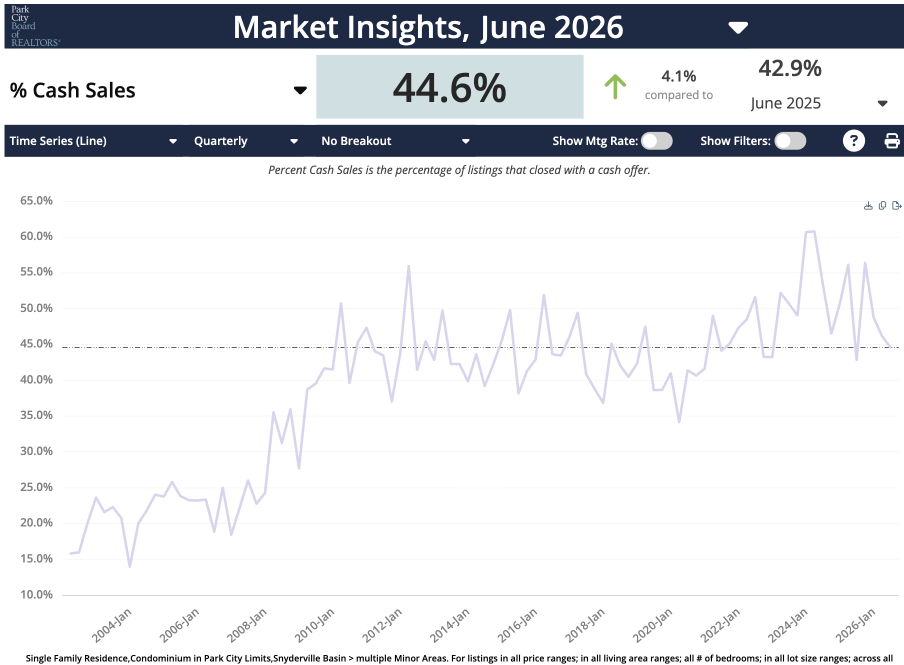
While cash sales were still higher than they were last year, they are still lower than they have been in recent years. As more buyers are financing properties, any disruption to mortgage rates is going to hinder both buyers’ ability to purchase and general affordability.
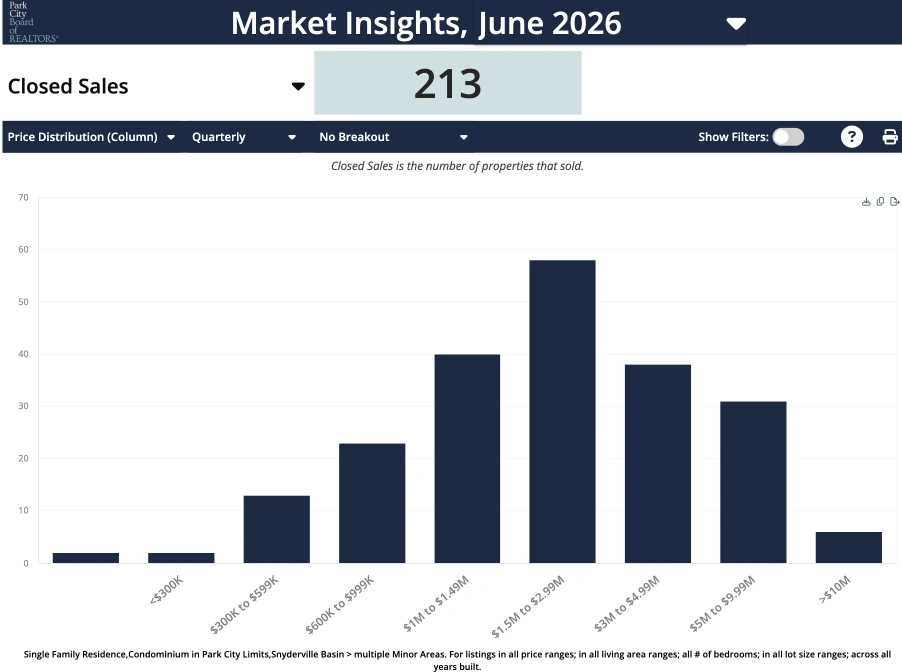
The price distribution chart is interesting to note. The distribution was relatively even in Quarter 2, which is unusual as the last few quarters’ sales have skewed towards the higher end of the curve, while Quarter 2 sales were weighted at the lower end of the curve. Historically speaking, the sub $3m price point has had a higher likelihood of financing for purchase, so when looking at the lower amount of cash buyers and the higher amount of sub $3m sales, it points towards an explanation for the overall slower velocity of the market.
Days On Market is not usually a figure I focus on, but it is becoming quite apparent that it is delineating the winners and losers in our market. Look at this breakdown:
Total Park City Market:
- Single Family Home, 107 sales: 10 DOM (median)
- Condo/Townhome, 106 Sales: 35.5 DOM (median)
The median days on market for single-family homes being only 10 continues to point towards the strength of that segment, which is a carry-over from Quarter 1, but also points towards pricing strategy. We are operating in a market where if you want to sell a property, you need to have the price dialed in up front, or an aggressive strategy to adjust pricing based on market feedback. Using comparable properties to price a home is only one piece of the puzzle and, in some markets, may not be entirely helpful as it is rear-facing and doesn’t reflect the current realities of a marketplace. However, this also means that if you are on the buy side and see a property that has broad appeal and is priced well it could be competitive. That is why our marketplace is full of stories about multiple offers on one street and months of no showings on the next one over.
Condo/townhomes continue to lag, even when priced well, requiring some patience. While homeowners may be willing to compromise on a house since it will be their primary residence, many second homeowners are far more particular about the condition of the property. They either need to be in top shape or be an excellent value if they are going to undertake the opportunity cost of a renovation.
Presently, we are in a market with a broad disconnect between buyers and sellers, which is not uncommon in a market where sellers don’t have to sell and buyers don’t have to buy. The data is telling the story that buyers are increasingly patient and are waiting for the right opportunity before writing an offer, and that some sellers are not connected to the current market realities.
The question will be whether or not those conditions shift during the third quarter. The summer market tends to be one of our busiest from a transactional standpoint, with growing inventory that needs to be absorbed. It will be interesting to watch whether buyers begin to make offers or sellers begin to incentivize them to jump in.