This thorough roundup and analysis of Q4 2021 stats was prepared by our resident MLS guru, and my partner, Justin Altman. He can be reached at justin.altman@sothebysrealty.com.
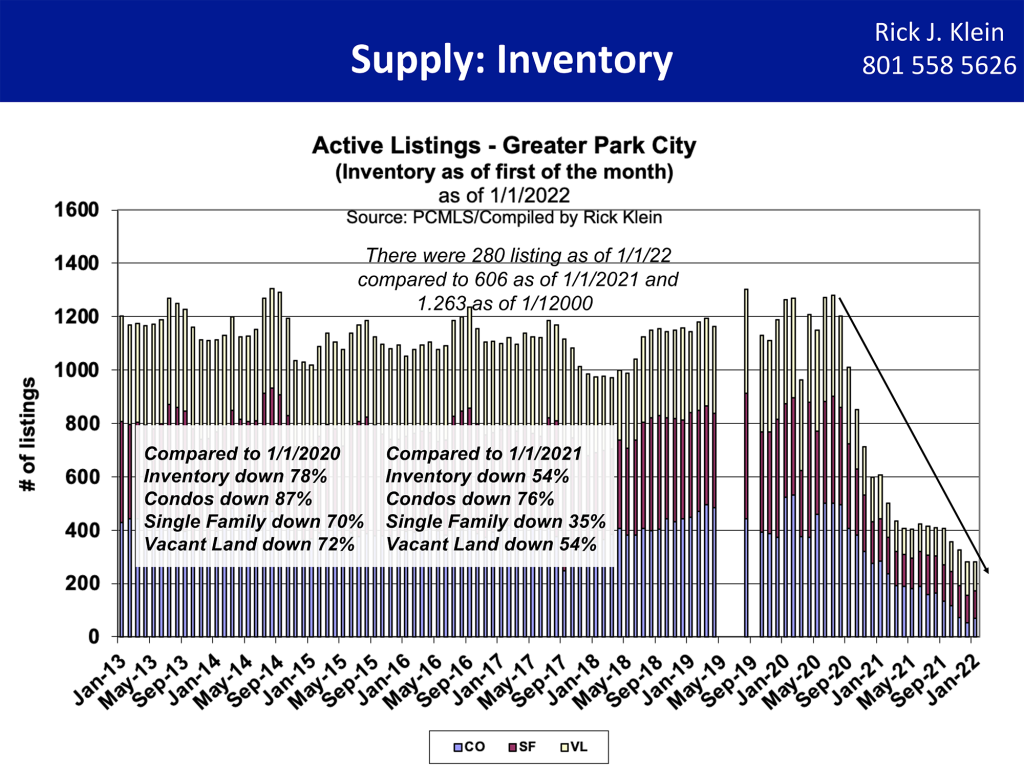
The story of real estate, not just in Park City, but across the United States, is inventory. When I wrote the 2020 wrap-up a year ago, the theme was inventory and demand. We were at historic lows, and buyer demand continued to surge. This is the sequel to that story.
On January 1, 2020, we had a total of 1263 properties listed on our Multiple Listing Service; this was well within the mean of inventory for the previous decade. On January 1, 2021, we had a total of 606 properties listed; a 50% reduction year over year and a new historical low level. On January 1, 2022, we had 280 total properties listed, representing another 50% drop year-over-year and a 74% reduction from our “Pre-Covid” inventory. Combine these inventory levels with insatiable buyer demand, and you have a perfect recipe for the aggressive driving forces behind rapid price appreciation and multiple offers.

According to the US Census, from 2010-2020, Utah was the fastest-growing state in the country, increasing total population by 18.4%[1]. Further, some projections suggest 30,000-40,000 people will be migrating to Utah annually over the next decade[2]. We are fortunate in Utah to have a diversified job market, ranging from medicine and tech to industries like construction. I want to illustrate that buyer demand is robust and would appear to be primed for continued growth over the coming years. Population growth will contribute to the inventory crunch we are experiencing. There truly is no “new normal” in which we can anticipate; we live in a world of “Pre-Covid” and “Post-Covid,” and the fundamental shift in American lifestyles, from work to life, are going to continue to have an enormous impact on the housing market.
Market Pricing
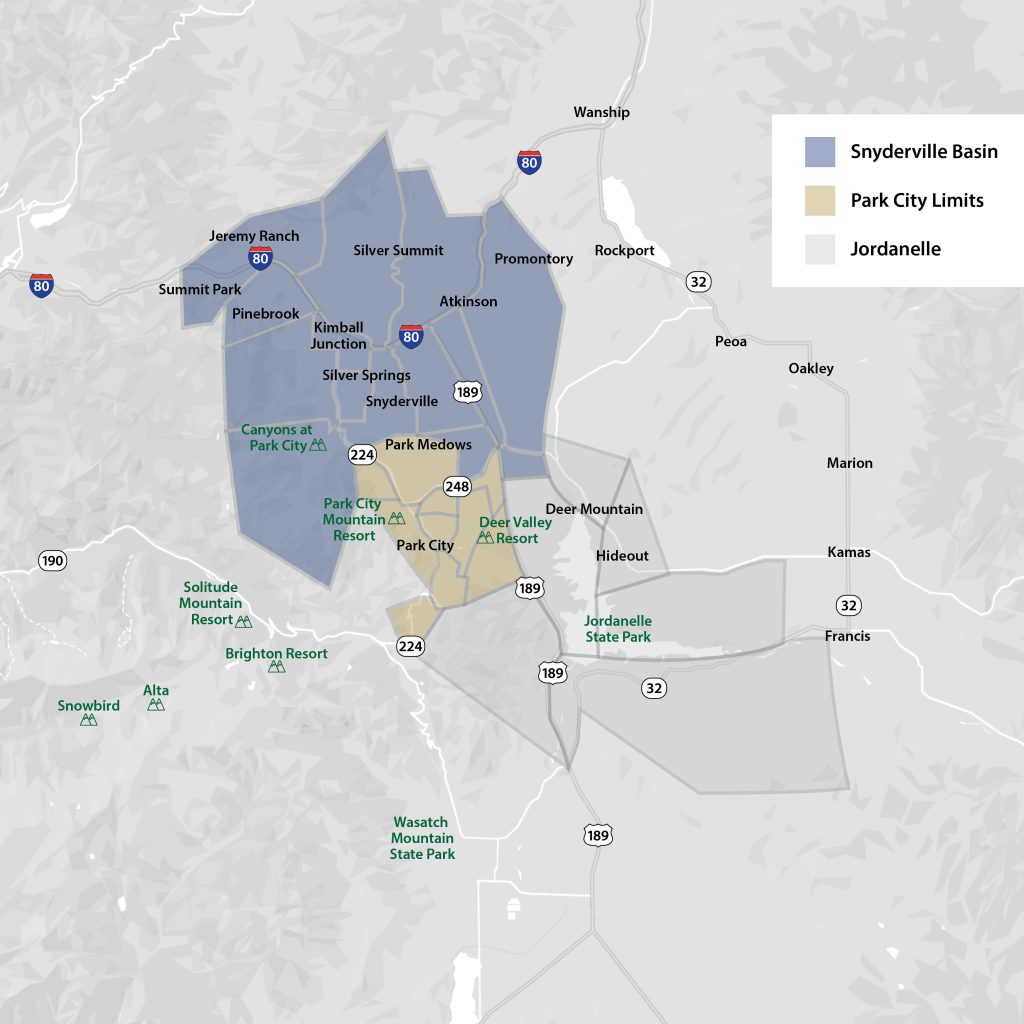
With the supply and demand context established, let’s jump into what is happening with pricing in the market. There are three primary areas I will focus on: “Park City Limits” (84060) “Snyderville Basin” (84098) and “Jordanelle District” (84032). Please see the map below as a reference.

We saw a surge in pricing for single-family homes in Park City limits (84060) in Q4 of 2021, with the average price skyrocketing to $4.821m, a robust 41% increase over Q3, and the median price jumping to $3.95m, increasing 36.2% over Q3. That is a massive jump, what happened here? The short answer is inventory has created a smaller sample size that is more susceptible to outliers. 46 homes sold in Q4; of those, only 9 were under $3m, and none were lower than $1.8m showing an elevated level of entry in terms of pricing. However, 11 of the properties sold were $6m+ with one selling for $19.45m and two selling for $11m. Those are certainly going to drive the average and median sale prices up aggressively, and while the average price is undoubtedly on the way up, it may not be quite at $4.8m yet.
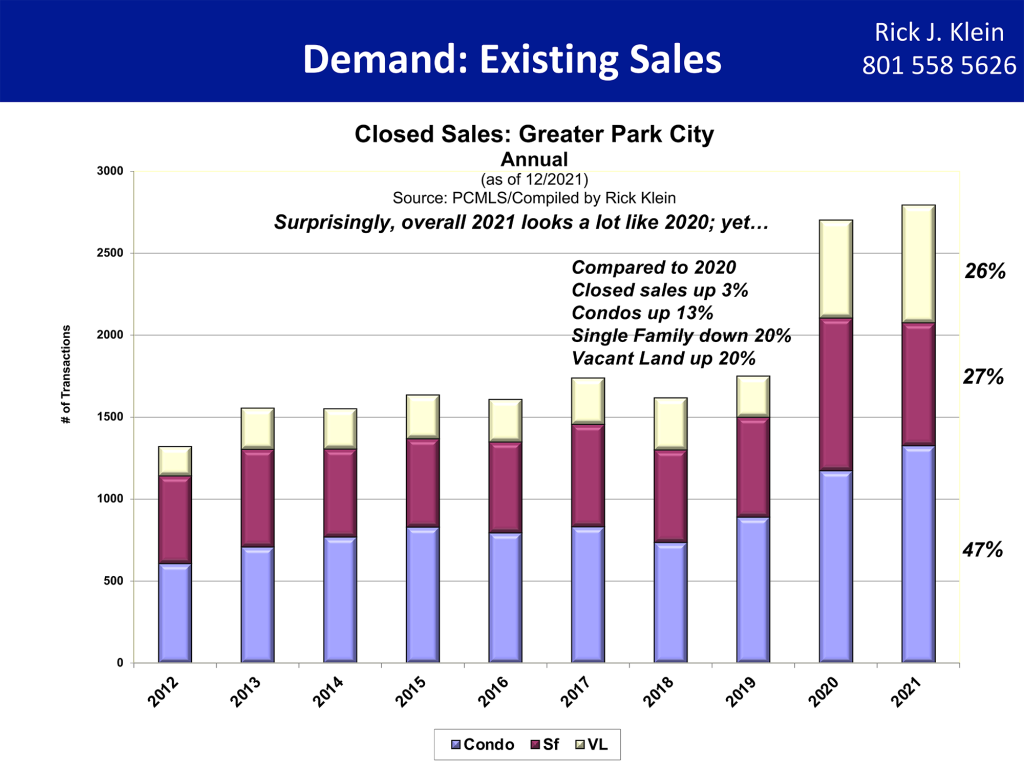
That said, the sales illustrate that buyer demand is strong at all price levels, even at the top of the market. By looking at the average home price on an annualized basis, we can get a better idea of the average price point in Park City Limits, which in 2021 was $3.887m and represented an increase of 34% from $2.911m in 2020. This is further evidenced by sales volume: 225 homes sold in 2021 in Park City Limits, a 26% decrease in quantity over 2020; however, the sales volume for 2021 was still $847m, which was only 2% or $20m below 2020.
The same story is present in Snyderville Basin (84098), with an average price of $2.963m in Q4 of 2021; this was a modest increase of 4.2% over the previous quarter. Looking annually, it is apparent that there are some significant gains. $2.827m was the average price in 2021, up from $2.377m in 2020. Of course, it is essential to look at the individual neighborhoods, particularly in this area. While the appreciation and increase in prices are likely constants between the neighborhoods, a handful of those neighborhoods skew the general prices. For example, the ski-in/ski-out gated community at the Canyons called the Colony had an average sales price of $15m in 2021. Neighborhoods like Promontory and Old Ranch Road also push those average and median numbers up, which is why I like to break down the individual neighborhoods to get a real sense of what is happening with pricing.
For the Jordanelle District, I will not focus on single-family homes because that isn’t the exciting aspect of this area. Jordanelle tells us the story of homesites and new construction, with neighborhoods like Golden Eagle, Skyridge, and Tuhaye being incredibly relevant to some recent trends that are emerging in our market.
Three critical factors are at play: acquisition price, construction costs, and timing, and so far have yet to be a deterrent for buyers. The amount of homesites sold in this Jordanelle area is truly staggering. 314 homesites sold in 2020; this increased by 37% to 431 homesites sold in 2021, of which the amenitized community Tuhaye accounted for 152! Anecdotally, from the sales director of Tuhaye, there will be a release likely in Q1 or Q2 of 2022 of 100 homesites at an average price of $1M, and they may be reserved entirely in the presale phase. Another community called Skyridge accounts for 84 lots sold in 2021. It is a brand new community on the north side of the Jordanelle reservoir which is experiencing quite the boon. The flexibility of the consumer base in Park City is a new trend, and while construction time and cost can be significant, getting the perfect home can undoubtedly be worth the wait.

Neighborhood Performance
Let’s get into the specifics and look at neighborhood performance. Park Meadows continues to be the forerunner for Park City. 54 single-family homes sold in 2021, which translates to about one home sold per week. This dropped 24% from 2020, but interestingly enough, the dollar sales volume only dropped 9% due to the increase in pricing, 17 fewer properties sold, but that only reduced the total sales volume by about $18m; we can thank the average price $3.267m for that. As these home prices go up, townhomes throughout the neighborhood will start replacing the “entry-level” homes that used to occupy this space. That doesn’t mean the price point will be entirely accessible – think $2m+. Due to the price increases, we will see more buyers expanding the scope of their search into adjacent neighborhoods, which brings me to my next community.
Silver Springs. I firmly believe this area is the beneficiary of Park Meadows jumping to the next level in terms of price. Silver Springs had 48 homes sold in 2021, a 28% increase over 2020. Not only that, but sales volume jumped 97%! The average price of a home skyrocketed 57% year-over-year, with an annual average in 2021 of $2.06m. Silver Springs experienced the highest annual appreciation over any other neighborhood in the Park City area. In Q4 of 2021, that number was $2.25m, and based on some recent transactions; there is plenty of runway for those numbers to go up. Again, if your option is a $2.25m townhome or a $2.25m single-family residence, the majority of buyers looking for a primary residence are going to choose the latter. The price increases create a ripple effect and move folks to adjacent neighborhoods as pricing goes up.
Pinebrook and Jeremy Ranch are robust, accounting for 102 homes sold in 2021 or about 22% in the Snyderville Basin. Pinebrook had a pretty steady number compared to last year, but Jeremy Ranch is a bit more interesting. An equal number of homes sold year over year at 62, but sales volume increased by 40% courtesy of the 40% increase in the average price of a home. That puts the average price of a home in Jeremy Ranch at $1.877m in 2021. These neighborhoods continue to be attractive to buyers due to their proximity to Park City, Salt Lake City, and the airport. With hybrid models of work from home, the ease of access to travel and the expansion of industries in Salt Lake City, I would anticipate seeing both of these neighborhoods continue to be popular destinations for buyers to purchase.
The final neighborhood I would like to touch on is Promontory. Again, Promontory was second to none in sales quantity and volume, with 284 properties closed in 2021. It encapsulates what is happening in our market, with low inventory, high demand, and many homesites being sold alongside new construction and resale. The single-family home volume in 2021 was $412m accounting for 33% of the total sold volume in Snyderville Basin and nearly 20% of the entire Park City market. Comments from the sales director indicated that based on feedback from both buyers and builders, the Park City marketplace has room to move up based on price/sqft in places like Jackson, Aspen, Vail, and Sun Valley.
Our Take on the Current Market
It is essential to point out that overall, within the Park City market, sales and pended contracts have been on a downward trend; this is due to constrained inventory instead of buyers slowing down and is just one of the market forces at play.
Market forces are powerful, and it could take some time to resume any level of “normalcy,” however, the timing is likely to be severely impacted due to historically low inventory and continued buyer demand, which even if it were to wane, would take time to get back to a balanced market. Some factors can contribute to a balanced market; however, I like to remind folks that Park City is a “luxury resort marketplace” and responds differently to market forces than, say, a metropolitan marketplace. For example, even though interest rates are likely to go up, we still saw 45% of total transactions have cash terms, with some areas pushed as high as 55%.
While interest rates will impact some buyers, it is still important to keep in mind what the rates are relative to previous years; we are exiting a period where interest rates were the lowest they have ever been and going back to interest rates that were already historically low even in the 4% range. Not every property in Park City qualifies for conventional financing either, so while conventional rates have been low, and that has helped, other lending products are frequently deployed. Overall I would anticipate 2022 to continue the trends of the previous two years, with inventory remaining light and buyers remaining engaged.
If you are interested in an area I did not cover or want to discuss anything further; please feel free to reach out!
[1] https://www.census.gov/library/stories/state-by-state/utah-population-change-between-census-decade.html
[2] https://www.sltrib.com/news/2022/01/30/utah-years-million-strong/