This thorough roundup and analysis of Q1 stats was prepared by our resident MLS guru, and my partner, Justin Altman. He can be reached at justin.altman@sothebysrealty.
Here we are, trucking headfirst into the summer of 21′ doing everything possible to return to “normal.” But are we ever going to get there? And what was “normal” anyway? I think we have a completely new idea of what “normal” is, and that definition is pretty tricky to nail down, but it plays a significant role in the future of real estate.
Tag along as I try to make sense of the new normal here in Park City and go over the various market conditions that appear to be at play!
Initially, I had planned to do a sneak peek of the Park City Q1 data and send it out at the end of March, but as I started moving through that information, I felt like it would play too much of a spoiler! We did not experience a traditional Q1—a quarter that largely falls by the wayside as transactional volume slides. In a typical year, I would expect to see a drop-off. The winter months are hugely popular for investment properties, so we see minimal turnover in that sector, and the school calendar means families are firmly ingrained where they live. There are other factors, but these are the two primary reasons for the colloquially termed “selling season.” Perhaps you could read between the lines and sense the foreshadowing: we did not have a typical Q1.
Simply put, Quarter 1 was massive.
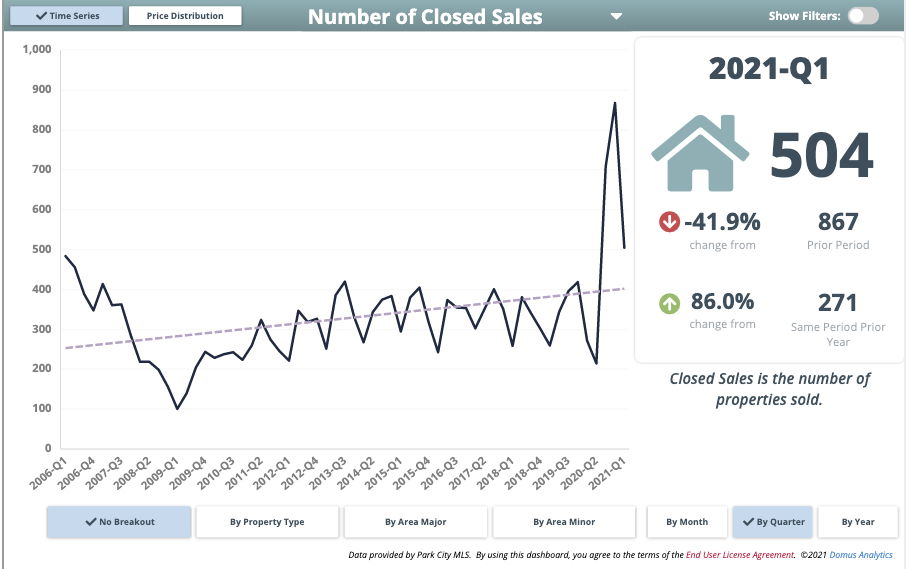
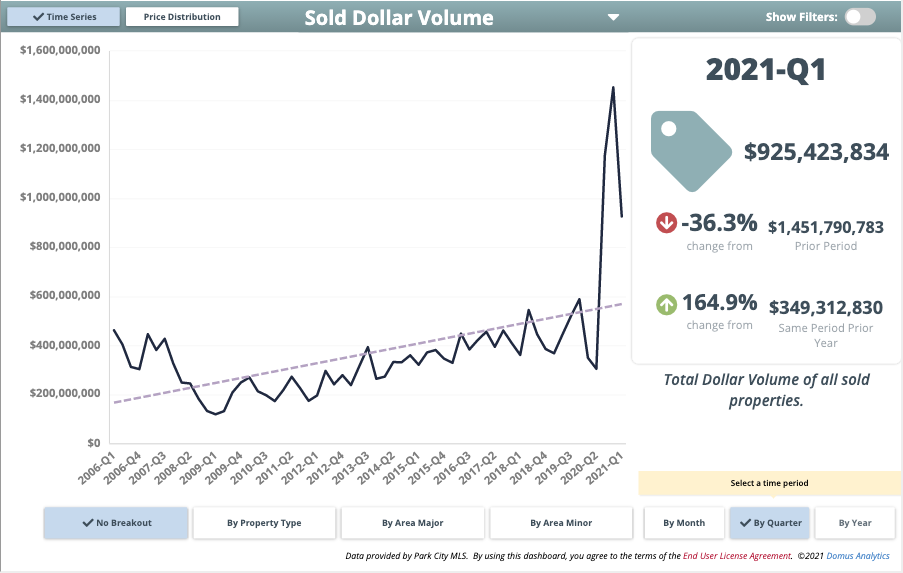
Q1 totaled 504 transactions coming in at $925m in sold volume. In the last few years, Q1, on average, delivered approximately 250 closed sales with around $350m in sold volume, so the market is still operating at a very high and fast rate. At this point, I am not sure it is even relevant to point out year-over-year differences as the numbers begin to get comical – 86% increase in transactions and 165% increase in sold dollar volume. As you can see, these are massive.
Still, it doesn’t tell us anything new. As I mentioned in my opening, we are dealing with a new normal; the goal is to understand what is happening and contemplate what could happen.


Are We Seeing 2008 All Over Again?
In terms of what is happening, there is a persistent question that dominates discussions around real estate. The articles you are most likely seeing and reading are regarding the similarities to 2008. I want to preface this by mentioning I cannot predict the future. Try as I might, I have yet to be able to pick winning lottery numbers.
Let’s talk about the most significant difference between 2008 and 2021: stringent lending requirements. Taking out a loan is now more invasive than a physical required to get life insurance. Banks do not want to lend money to folks who cannot make the payments. Couple that with the following: in the Park City market, we saw 49% of total transactions in Q1 made with cash.
Immediately, there is a stark difference in the type of consumer purchasing real estate now. In 2008, folks were acquiring mortgages with 0% down payments and minimal verification of employment or ability to make payments. Now, we have exceptionally well-qualified folks purchasing a property. Not based on speculation of increased values, but driven by lifestyle and work changes that have revved up demand.
Should the work from home revolution continue and more companies acquiesce to their employee’s wishes, there is an excellent chance we will continue to see large migrations to our city. Without harping on this too long, I would argue that this market only resembles 2008 in graph form, but the context and details are entirely different. Supply is not artificially low, demand is keeping it down.
What Role is Inflation Playing?
However, in 2021 there is another interesting wrinkle to keep in mind: inflation.
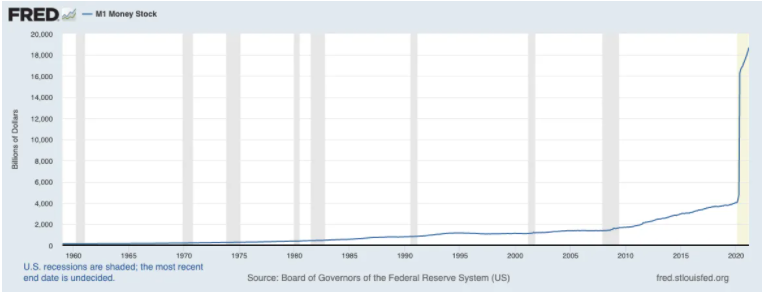
Inflation is a curious topic because it hasn’t played a critical role in our real estate market, mainly because the flow and creation of money haven’t ever really spiked like it did over the last year – see below.

Anytime the Fed prints more money, the existing cash becomes devalued, and the inflation rate goes up. To protect against inflation, it is generally wise to have diverse investments that will grow in value over the rate of inflation. It is particularly unwise just to be sitting on cash or stocks at this moment.
Because of this, I am hearing discussion and anecdotal evidence of traditional “investors” diversifying their portfolios by purchasing real estate as a store hold for their buying power. Let me put this all together for you and wrap it with a neat bow: aside from the general demand that Park City has due to traditional reasons (lifestyle, access to travel, cost of living), we now have another reason for folks to purchase property, as a hedge against inflation. Whereas savvy and wealthy individuals may have previously sought to keep their money tied up in the markets, it is now becoming advisable to tie cash up in assets and diversify portfolios.
“But Justin, this run of value cannot continue forever. You can’t guarantee returns over 15% year-over-year in perpetuity!” To which I say, you are correct!
That isn’t what these investors are looking at, though. Consider this: putting money into property in the Park City area before 2020 represented a steady and robust investment. From 2009-2019 property value appreciation was 6-8% each year, until 2020, when property values skyrocketed. If your goal is to hedge against inflation and have a store hold for your money, even when Park City regresses to its mean (6-8%), the value of that investment is still going to beat inflation and maintains your buying power. Plus, unlike traditional investments, you can use the asset. It is a tangible product.
I am optimistic 2021 will continue the trends of 2020.
Top 10 Park City Real Estate Stats of Q1
Alright, let me give you the Sports Center top 10 stats out of Q1!
1. Total residential listings for Q1 were 786 – this is a 17% increase from 2020.
I like this stat because it destroys the notion that there is no inventory – there is inventory. It just isn’t staying on the market very long. Speaking of…
2. 25% of Single Family Homes and 33% of Condos in Park City were under contract within 72 hours of being publically marketed.
There were a good number of properties that sold before being publically marketed.
3. At the end of Q1, only 651 residential listings were available for sale – compare this to 1909, which was available on the same date a year ago.
Again to emphasize this point – there is inventory; it just won’t sit very long or at all.
4. The median price of a single-family home in Park City limits is up 38% – $2.7m & Snyderville Basin saw an increase of 31% – $1.63m.
Prices will continue to go up until there is robust supply or reach an inflection point where buyers are unwilling to meet the seller’s demands. There are only a handful of properties that we have seen come on overpriced where buyers have pushed back – primarily due to the home being undesirable.
5. Promontory continues to dominate the market share – 153 units sold, $435m in transactional volume.
Promontory checks many boxes for folks looking to diversify their portfolio – gated golf community with a ton of amenities, easy to be a primary or secondary residence, and likely to maintain and grow in value.
6. Sun Peak/Bear Hollow condominiums and townhomes saw the most considerable rise in the condo market. The median price is up 50% from 2020, moving from $515,000 to $751,000.
The condos and townhomes of Sun Peak/Bear Hollow are in a great location with easy access to everything – the fact that both short-term and long-term rentals are available makes them attractive to folks looking for a secondary property.
7. For the first time in recent memory, Vacant Land sales took off – up 180% year over year.
Park City limits only had 54 lots sold, but that pushed the median price up 19% to about $1.28m
Lot sales took off as folks either couldn’t find the home of their dreams, or they opted to build a house – price of lumber notwithstanding.
8. Speaking of lumber – estimates suggest the average home is now $38,872 more to build now than last year, courtesy of the 250% increase in the price of lumber.
The lack of available workers only compounds this. Between the two, construction costs are incredibly high.
9. Q1 2020 saw 49% of total transactions completed with “cash.”
The critical caveat we saw were contracts written without Finance and Appraisal conditions. There are plenty of folks who can afford to pay cash and wrote offers as such but took advantage of low rates and borrowed some portion of the money.
10. Difficult access to inventory has pushed buyers to outlying areas, particularly the Heber Valley, which experienced appreciation of single-family homes of 42% and condominiums 23%.
Key Takeaways
- The Park City market continues its hot streak with inventory being snatched up faster and for higher prices.
- Many factors differentiate 2021 from 2008.
- There ought to be a decrease in buyer demand, coming down from the highs of 2020. However, I anticipate the new “normal” for buyer demand to still be higher than before the Covid outbreak. This number is also entirely dependent upon the decisions from companies in regards to work-from-home.
- Prices are unlikely to come down, but there is a good chance specific neighborhoods and properties reach an inflection point. A price ceiling would help keep pricing more consistent with fewer jumps between listings.
Thank you so much for reading. I hope you enjoyed it, and if you have any specific questions, please feel free to reach out!
1 Comment
This is an incredibly comprehensive and well written synopsis of the PC RE market. Thank you for providing data and facts during an unbelievable real estate time frame. We feel fortunate to have sold and purchased our houses with Nancy and Justin – true professionals indeed!