It appears the United States has entered a “K-Shaped Economy*” and the macroeconomic climate’s reverberations are certainly reflected in the Park City real estate market. Quarter 3 illuminated not only the stark contrast between price points but also a division between property types; looking back at the data, I believe we have also entered a “K-Shaped Real Estate Market.”
This presents itself in two ways. In the traditional sense, the luxury market has seen more velocity and activity than the entry and mid-level of the market. This is where the higher earners and top portion of the economic ladder are experiencing favorable conditions and improvements. The second way this is presenting is by property type, with single-family homes significantly outperforming the condo/townhome market. The contrast between the two is significant and worthy of the imagery of the “*K-Shape.” Before diving into the split between the markets, please see below for the overall data summary.
Park City Limits (84060) & Snyderville Basin (84098) – All Property Types
Median Sales Price: $2.25m, up 3.7% YoY, up 10% QoQ
Average Sales Price: $3.497m, up 18.9% YoY, up 12.7% QoQ
Total Sold Properties: 254, down 12% YoY, up 17.6% QoQ
Percentage of Cash Sales: 55%
New Properties Listed: 432, up 9.1% YoY, down 17.9% QoQ
Properties Under Contract: 276, down 13.5% YoY, up 24.3% QoQ
(YoY means “Year over Year” and QoQ means “Quarter over Quarter”)
There are a few notes to be made here; the quarterly increases are to be expected, as sales prices and closed sales typically spike during the summer months, and new properties typically start to taper after peaking in June – so those variations are not too surprising at all. The 12% decrease in sales year-over-year, along with the decrease in properties under contract by 13.5% all while inventory is up 9.1%, is intriguing and the explanation presents itself below when we break out the inventory.
At this point, it goes without saying that the macroeconomic environment we find ourselves in presents significant headwinds; the combination of uncertainty and increasing interest rates makes for a difficult duo to overcome. However, even in markets with uncertainty and lower velocity, properties still sell. Take a look below to see the single-family data broken out.
Park City Limits (84060) & Snyderville Basin (84098) – Single Family Homes
Median Sales Price: $3.3m, up 28.3% YoY, up 24.5% QoQ (Tied for 2nd highest quarter ever)
Average Sales Price: $4.488m, up 21.3% YoY, up 10.1% QoQ (2nd highest quarter ever)
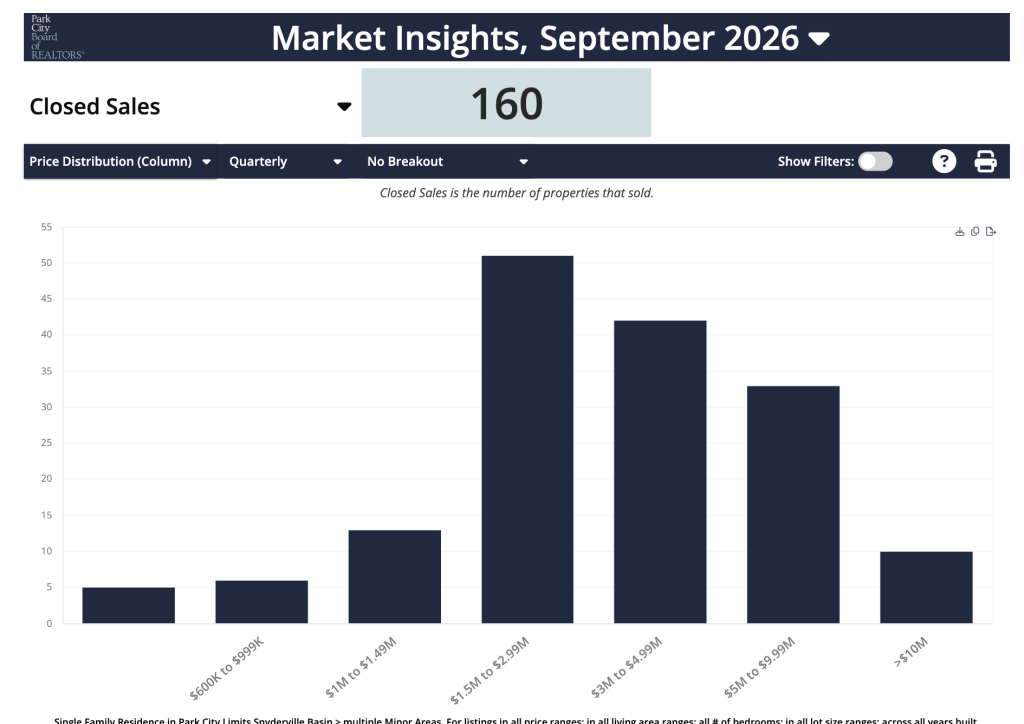
Total Sold Properties: 160, up 1.3% YoY, up 45.5% QoQ
Percentage Cash Sales: 53.7% (For comparison’s sake – Q2 was 37.3% – demonstrating the squeeze on financing)
New Properties Listed: 236, up 14% YoY, down 7.1% QoQ
Properties Under Contract: 166, down 5.7% YoY, up 39.5% QoQ
These figures actually look pretty good, and in fact the amount of closed sales represents a regression to the mean in transactional volume. Taken at face value, the single-family market in Park City is healthy and robust, but this is where the K-shaped economy really shows itself. The median and average sales prices are at record highs, which is a tremendous data point.
Promontory accounted for 54 of the 160 homes sold. A huge increase in the membership deposit and changes to membership rules in Q3 juiced sales in the latter part of the quarter, but it took a doubling of sales at Promontory to keep Park City on pace and even year-over-year. If the numbers were closer to average at Promontory, total sales in our market would be down 10% across the board.
Neighborhoods with historically high sales in Q3 were all mostly down:
Jeremy Ranch: 7 homes sold, down 62% year-over-year
Park Meadows: 7 homes sold, down 38% year-over-year
Old Town: 5 homes sold, down 74% year-over-year
Another interesting tidbit regarding single-family sales:
Total Sales for Homes Priced from $1m-1.5m: 14
Total Sales for Homes Priced $10m+: 14
Five of the fourteen sales in the $10m+ category were, in fact, $20m+, making the very top of the market as active as the entry point to the Park City market, which is quite unusual. The center of gravity moved from the $1.5-3m bracket into the $3-5m bracket, with the majority of sales happening in the higher price point. K-shaped economy and K-shaped real estate market.
Homes that did not have a price reduction had a median of 18 days on market and a list-to-close price ratio of 98%, meaning homes that were priced right sold within the first three weeks and very close to list price.
Homes that had a price reduction had a median of 92 days on market, reduced the price on average by 6.6%, and had a list-to-close price ratio of 95% – meaning homes that came out of the gate high and did not aggressively adjust price sat longer, reduced higher, and ended up selling on average for 10% off.
Park City Limits & Snyderville Basin – Condo/Townhome
Median Sales Price: $1.3m, down 3.6% YoY, down 2% QoQ
Average Sales Price: $1.846m, down 9.4% YoY, down 11.8% QoQ
Total Sold Properties: 94, down 28.2% YoY, down 11.3% QoQ
New Properties Listed: 236, up 14% YoY, down 11.3% QoQ
Properties Under Contract: 110, down 23.1% YoY, up 6.8% QoQ
The condo market has been feeling the squeeze of interest rates more than single-family homes since many of the condominiums in our market are second homes or investment properties, which invite a higher interest rate. Furthermore, the FHA increased requirements for HOAs to qualify for conventional financing, which has pushed some properties into even higher interest rate, non-conforming loans. This is coupled with higher HOA fees overall, lower rental revenue, and both an aging and growing inventory.
Looking at condo sales year-to-date, we are on track for the second-lowest sales totals in this category ever; only 2009 would be a worse year if we continue tracking as we have this year. It is not as though everything stopped; condo inventory is still selling. However, the consumer for this product has significantly more choice and leverage than has been had in a long time. At the end of September, active inventory in this segment totaled 340 units, which is a 43% increase year-over-year, and this summer represented the highest active units since summer of 2020.
I would also attribute the historically weak winter we experienced in 2025-2026 as a partial contributor to the slowdown, which is something we typically see in future bookings. When we have a great winter, future bookings for the following season tend to increase, while when we have below-average winters, bookings the following season take a dip. This year, we have the combination of the historically poor winter with the economic headwinds described above, and it is all coming together in the data.
As a reminder, the data is rear-facing; it doesn’t really tell us too much about the future but provides context to the environment that we operate in. Watching how the market changed from the middle of March to the middle of May was a reminder that things can change rapidly. My expectation based on the economic forecasting, though, is a longer run of higher rates, likely into next year. I don’t anticipate any economic activity that is going to drop mortgage rates and reverse the course of the housing market in rapid succession.
The data from Q3 provides a lens with which to review market participant behavior in a difficult environment. It has been over 6 years since buyers had this type of opportunity when purchasing a condo, providing condo buyers with maximum leverage. If you are a seller of the type of inventory that is appealing to the top end of the market, this is a great time to participate.
I am curious and eager to see how winter impacts our market and what Q4 brings. I would not be surprised to see muted activity. Historically, Q4 is not robust, and many people end up punting to the beginning of the next year to buy or list properties. With the super El Niño forecasted, let’s hope to see some significant snowfall and cooling of economic events!
We already have a bit of snow on our mountain peaks, which is encouraging.
* A K-shaped economy describes an economic recovery or trend in which wealthier individuals and successful businesses continue to prosper while lower-income households and struggling businesses fall further behind, widening economic inequality.