If you were to judge the Park City real estate market based on the annual numbers alone, it may appear that the market has coalesced into a new groove; the overall number of sales, the average and median pricing, and overall demand are returning to pre-pandemic levels.
However, when broken out, there are a number of stories to tell – from a red-hot Q1 driven by publications and predictions of significant interest rate drops to the “slam on the brakes” during Q2 when inflation picked back up. Q3 felt the ramp-up to the election and a “stickier than anticipated” inflation issue. Then, Q4 picked up where Q1 left off due to the first interest rate drop and the conclusion of the presidential election cycle.
I believe the largest takeaway from 2024 is that uncertainty gives the market pause and that regardless of results, once there is clarification, things pick back up. Let’s dig into it.
2024 Park City Real Estate Metrics
Looking over the key metrics, we find:
- Median Sales Price: $1.7m (vs $1.698m in 2023)
- Average Sales Price: $2.541m (vs $2.615m in 2023)
- Closed Sales (Sold Properties): 947 (vs 887 in 2023)
- New Properties Listed: 1447 (vs 1328 in 2023)
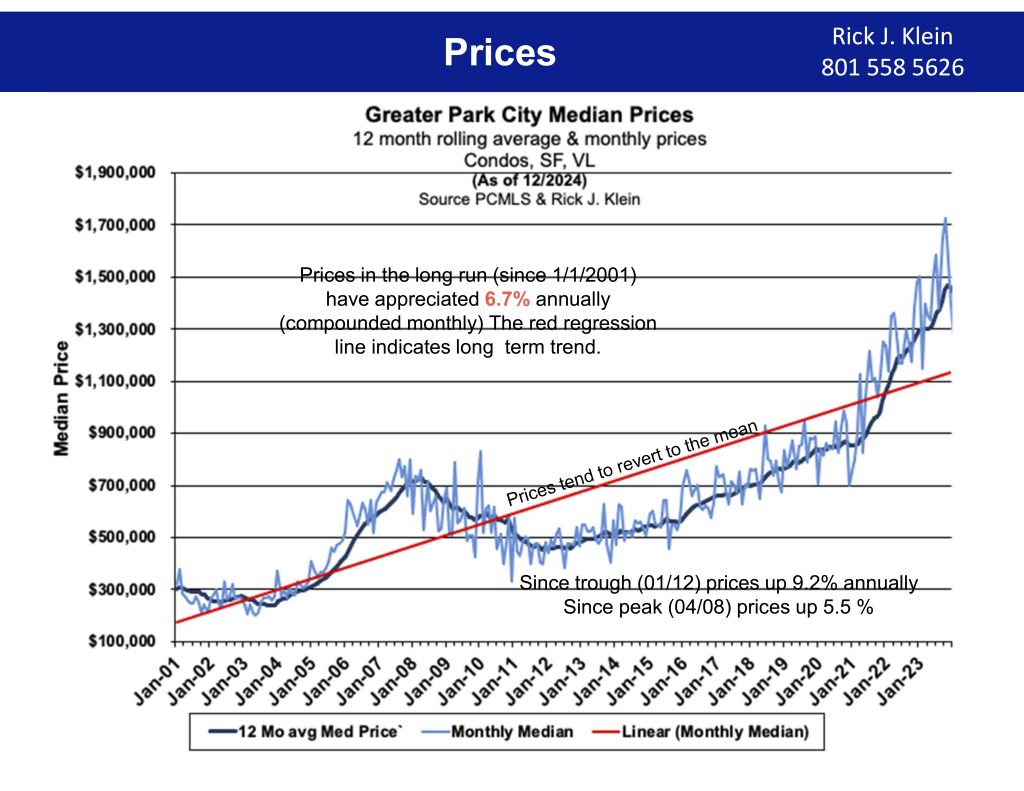
Both closed sales and new inventory showed nominal gains in 2024 with a nice tick-up, but they are still sitting below our pre-pandemic averages. Overall pricing was flat, which I attribute to high interest rates, stickier than anticipated inflation data, and low inventory. Flat pricing in this circumstance is a positive. Typically, there tends to be a reversion to the mean when you see a large variation in appreciation or depreciation.
Simply put, when data strays from the average, it tends to come back. Given that we experienced meteoric appreciation from 2020 to 2022, a return to reality was predictable. There are two ways this can happen: by crashing down (see 2006 to 2008) or remaining flat until the average catches back up.
Taking a look at Q4 specifically, it is evident that the presidential election played a role in people’s decisions to purchase property, and there was a clear jump in transactional volume following the election. In fact, Q4 closed sales outpaced Q3, which is abnormal. Typically, Q3 is the stronger quarter for closed sales, but given all the externalities, closed transactional volume pushed into the latter part of the year.
Park City Home Sales in 2024
When it comes to what was selling, new construction and turnkey properties were and are in high demand. Properties that need updating or significant work tended to sit on the market unless priced as a value proposition. Given the higher interest rates and the price point we are working at, the ability for buyers to pay for renovations on properties can be difficult. When you factor in the ancillary costs associated: renting another property, budgeting with rising supply costs, mortgage, and interest, the conclusion to buy the turnkey product, even at a higher price point, tends to win out. It is also a convenience factor, as many of our buyers come from out of the area and do not have connections to local vendors.
Promontory Trend
After reviewing the data, I found something interesting happening at Promontory. This neighborhood is a workhorse, but in Q4, it accounted for 25% of all sales in the 84098 zip code. I believe the demand for not only Promontory but other gated amenitized communities illustrates our type of market demand: new construction in a community with amenities in full-time and resort neighborhoods. These buyers are not as interest rate sensitive, and across the entire market in 2024, 52.2% of our transactions were cash deals.
2025 Real Estate Trend Forecast
As we move into 2025, it will be interesting to watch and see how many people opt to continue to wait to buy, either because they can rent a property for less than a mortgage or because they are locked into a sub-3% rate.
Here is a sneak peek at January’s data and the trends I see emerging.
The average sales price in January 2025 was $4.191m, which set a record for average sales price in a month by $800,000! Further, 58.5% of those deals were cash. Now, typically in January, we see resort real estate move, which tends to be at a higher price. But overall, to see such a significant jump illustrates that the top end of the market continues to be the focal point for many buyers, even with mortgage rates averaging 7%.
The number of properties that closed in January returned to historic averages as well; however, inventory levels hit their lowest since the low in 2022. Part of this is seasonality, as we typically hit our lowest inventory levels from December through February before building back up. I am intrigued to see how the market progresses through 2025 and how Q1 will end up!
As always, if you would like to discuss specifics about your neighborhood or any neighborhoods of interest, please reach out. All real estate is local, and each neighborhood market is nuanced.