If you are a numbers geek, you will enjoy this 2020 Park City Real Estate Market Review written by my partner, Justin Altman. You will start seeing more blogs written by Justin in the future. One of his many specialties is his love of numbers and his analytic skills. Please enjoy and let us know if you have any questions about the data presented below.
The Top-Down View
This first number is going to absolutely blow you away because it so perfectly illustrates what happened to the Park City market in 2020.
Park City “Sold Dollar Volume”
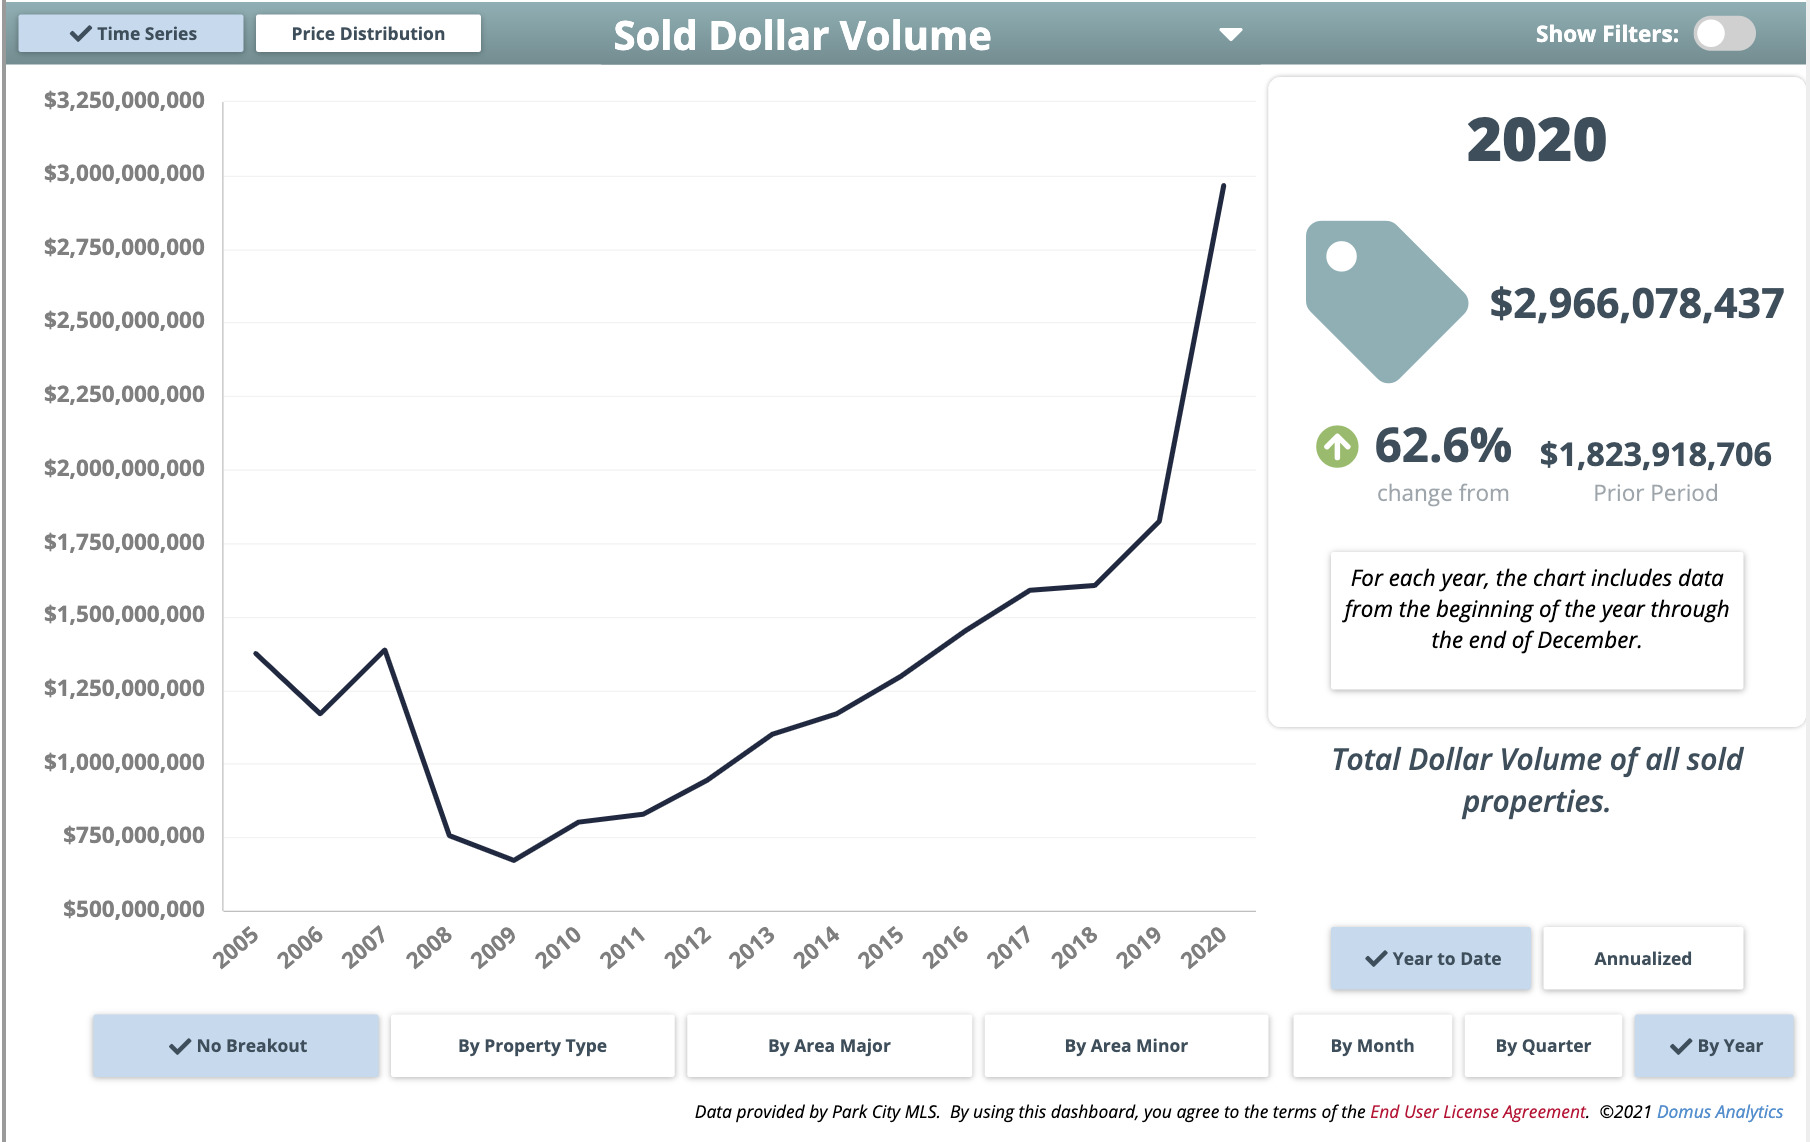
- 2019: $1,823,918,706—A cool $1.8B market cap for 2019. Since 2009 Park City experienced consistent growth to its market cap ranging from $100-200m per year.
- 2020: $2,966,078,437—In a single year Park City’s market cap grew $1.1B, representing a 62.6% increase in real estate sales volume. This number is anticipated to go down for 2021 – not due to lack of demand, but lack of supply.
Park City “Average Sold Price”
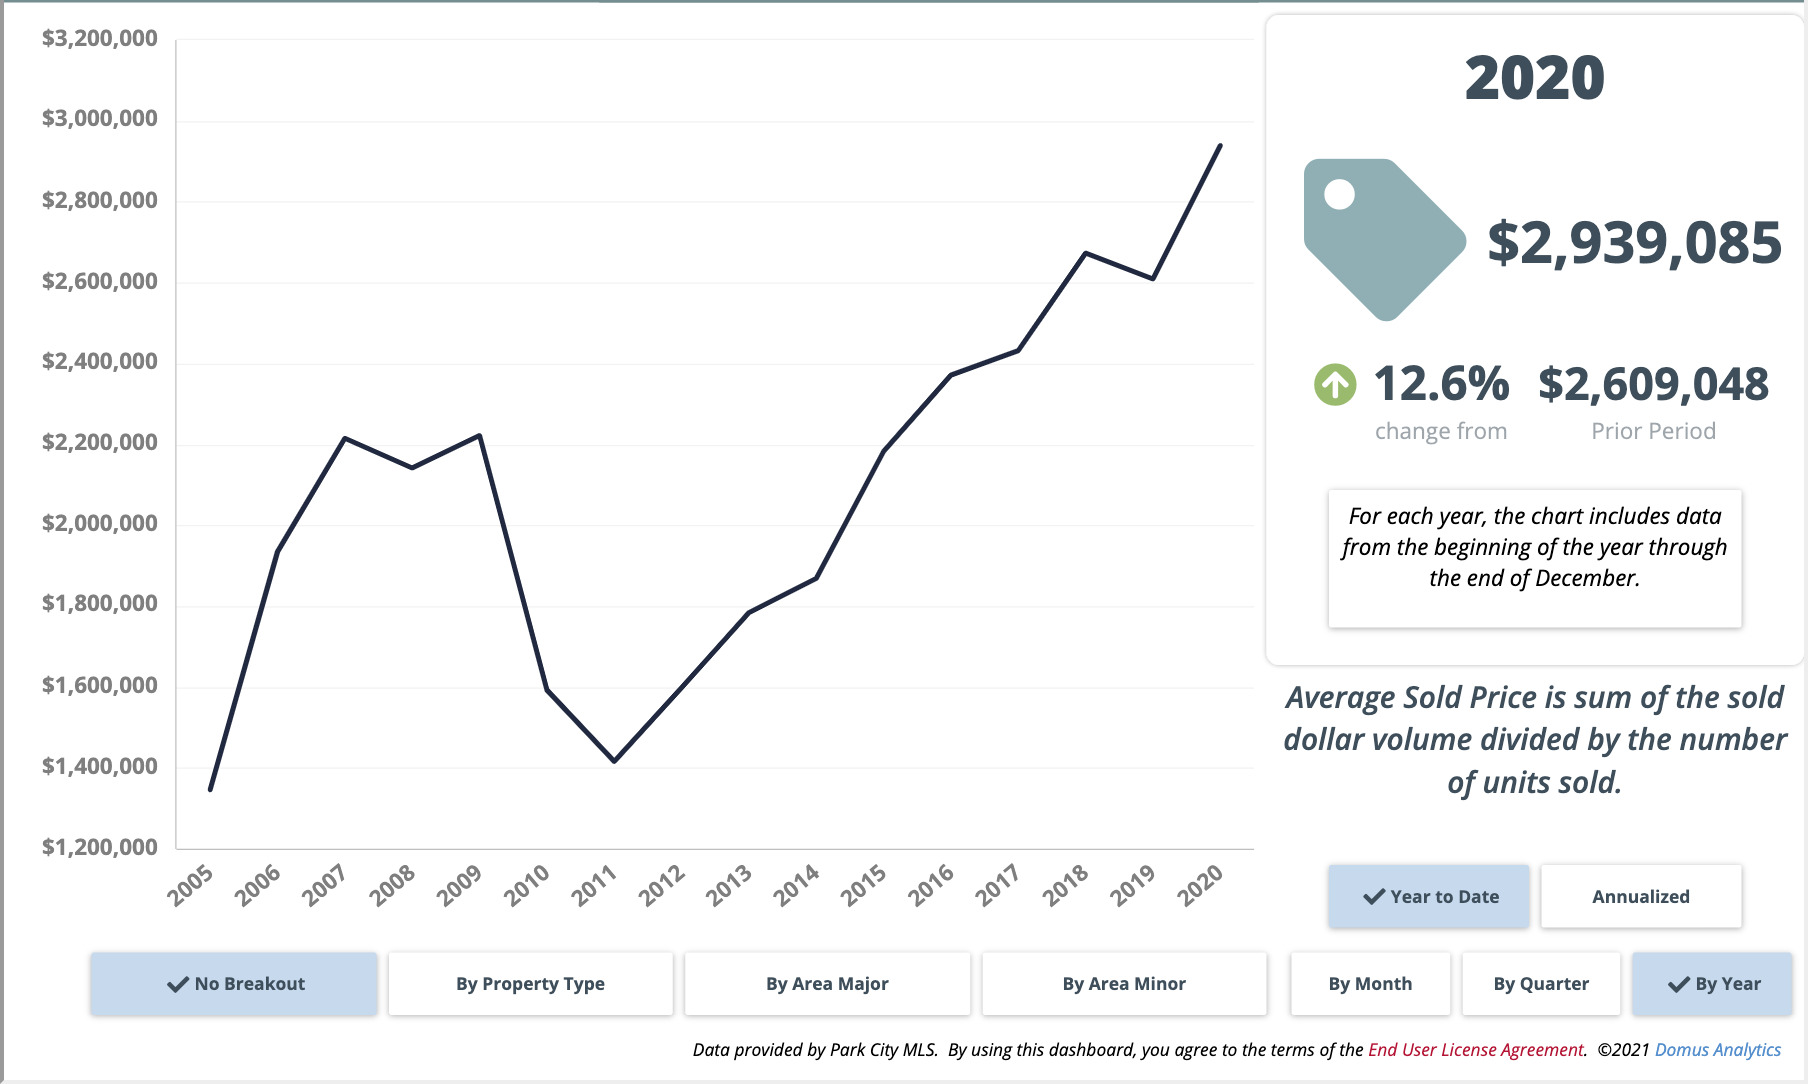
- 2020 Single Family Homes in “Park City Proper”: $2,939,085—This is a 12.6% increase from our average in 2019 which was $2,609,048.
- 2020 Condominiums in “Park City Proper”: $1,383,989—This is a 27.6% increase from our average in 2019 which was $1,084,953. *An important note – new developments can significantly skew the “average” price. This is particularly true in Deer Valley with an average price point in the $3-4m range being grouped together with properties at a lower price point.
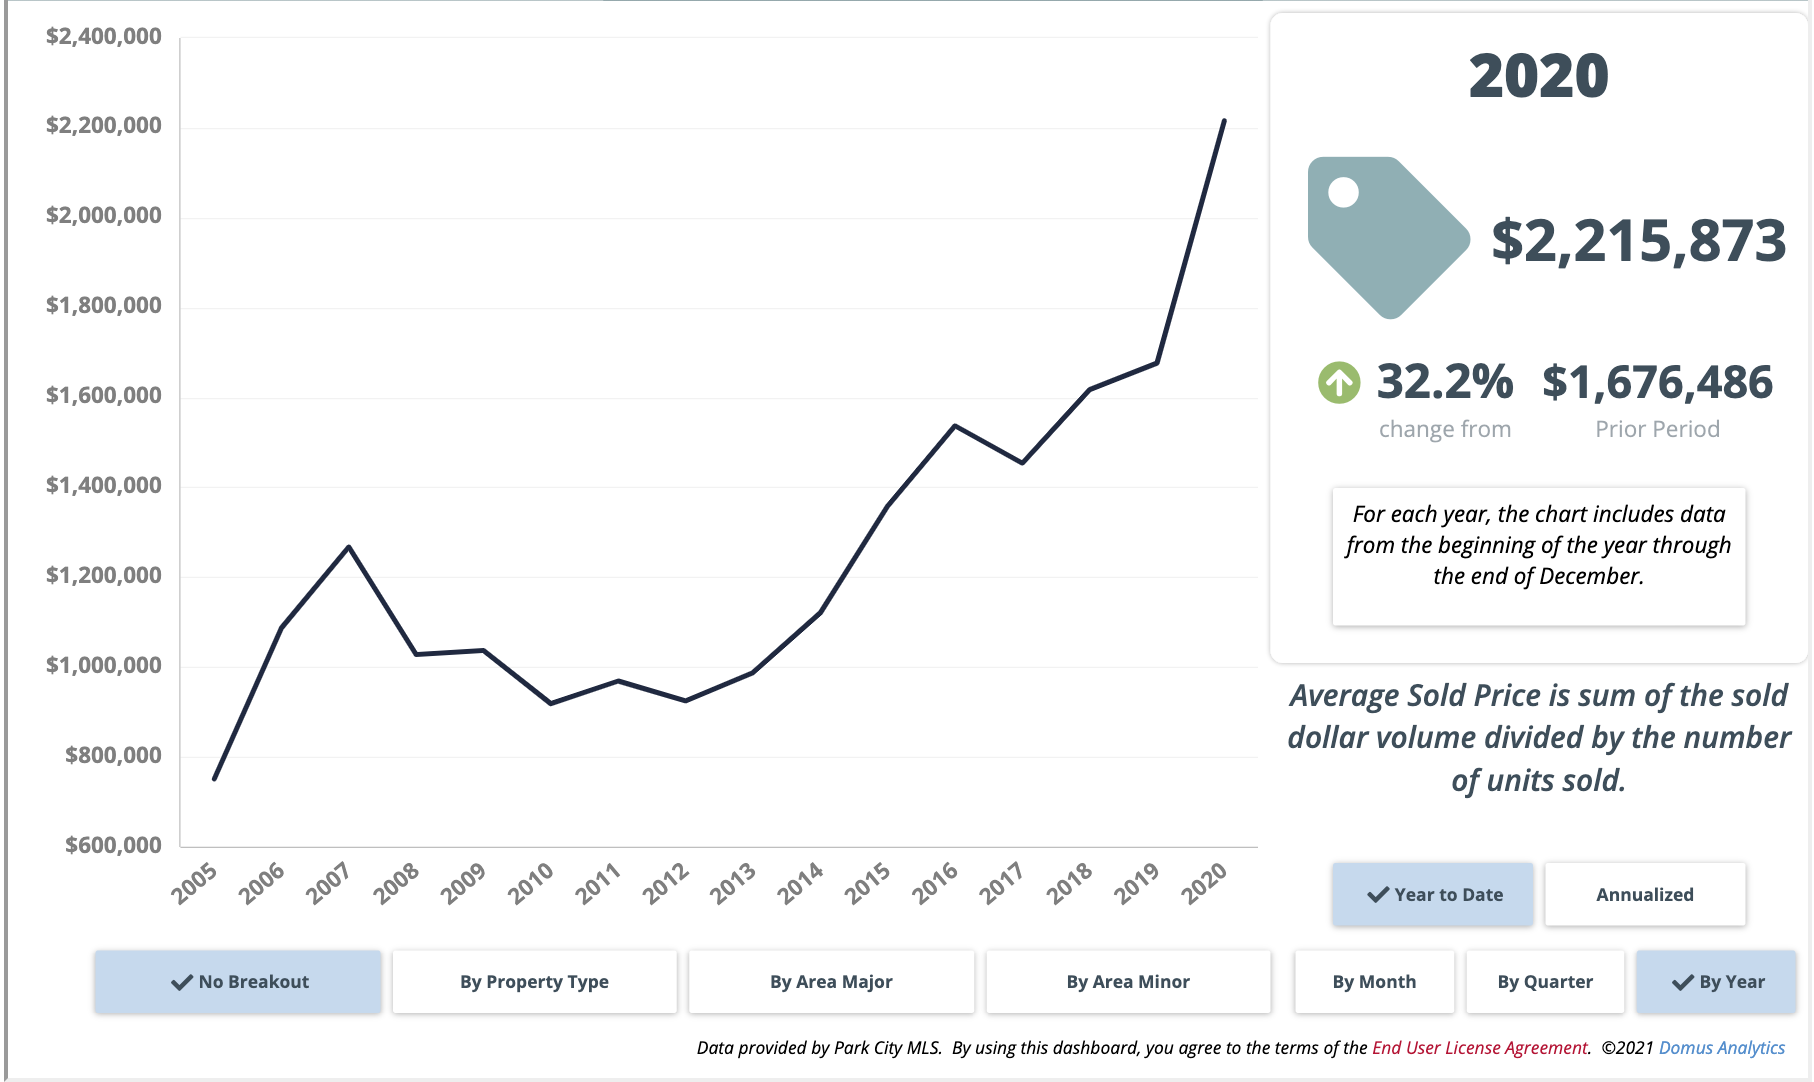
- 2020 Single Family Homes in “Snyderville Basin”: $2,215,873—This is a 32.2% increase from our average in 2019 which was $1,676,486.
- 2020 Condominiums in “Snyderville Basin”: $758,326—This is a 17.9% DECREASE from our average in 2019 which was $923,452. *Remember my note from above, in 2019 Canyons Village completed two significant projects (Apex + Lift) with a higher price point than what is the average for the area, skewing it high. 2021 will likely shoot through the roof with the completion of Pendry Residences.
How Many Transactions in Park City Were Cash?
- In 2020 about 49% of all transactions in Park City were cash.
- In “Park City Proper” about 50.5% of transactions were cash.
- In “Snyderville Basin” about 45.75% of transactions were cash.
- Promontory topped out neighborhoods for cash buyers with a whopping 67.5% of all purchases being made with cash.
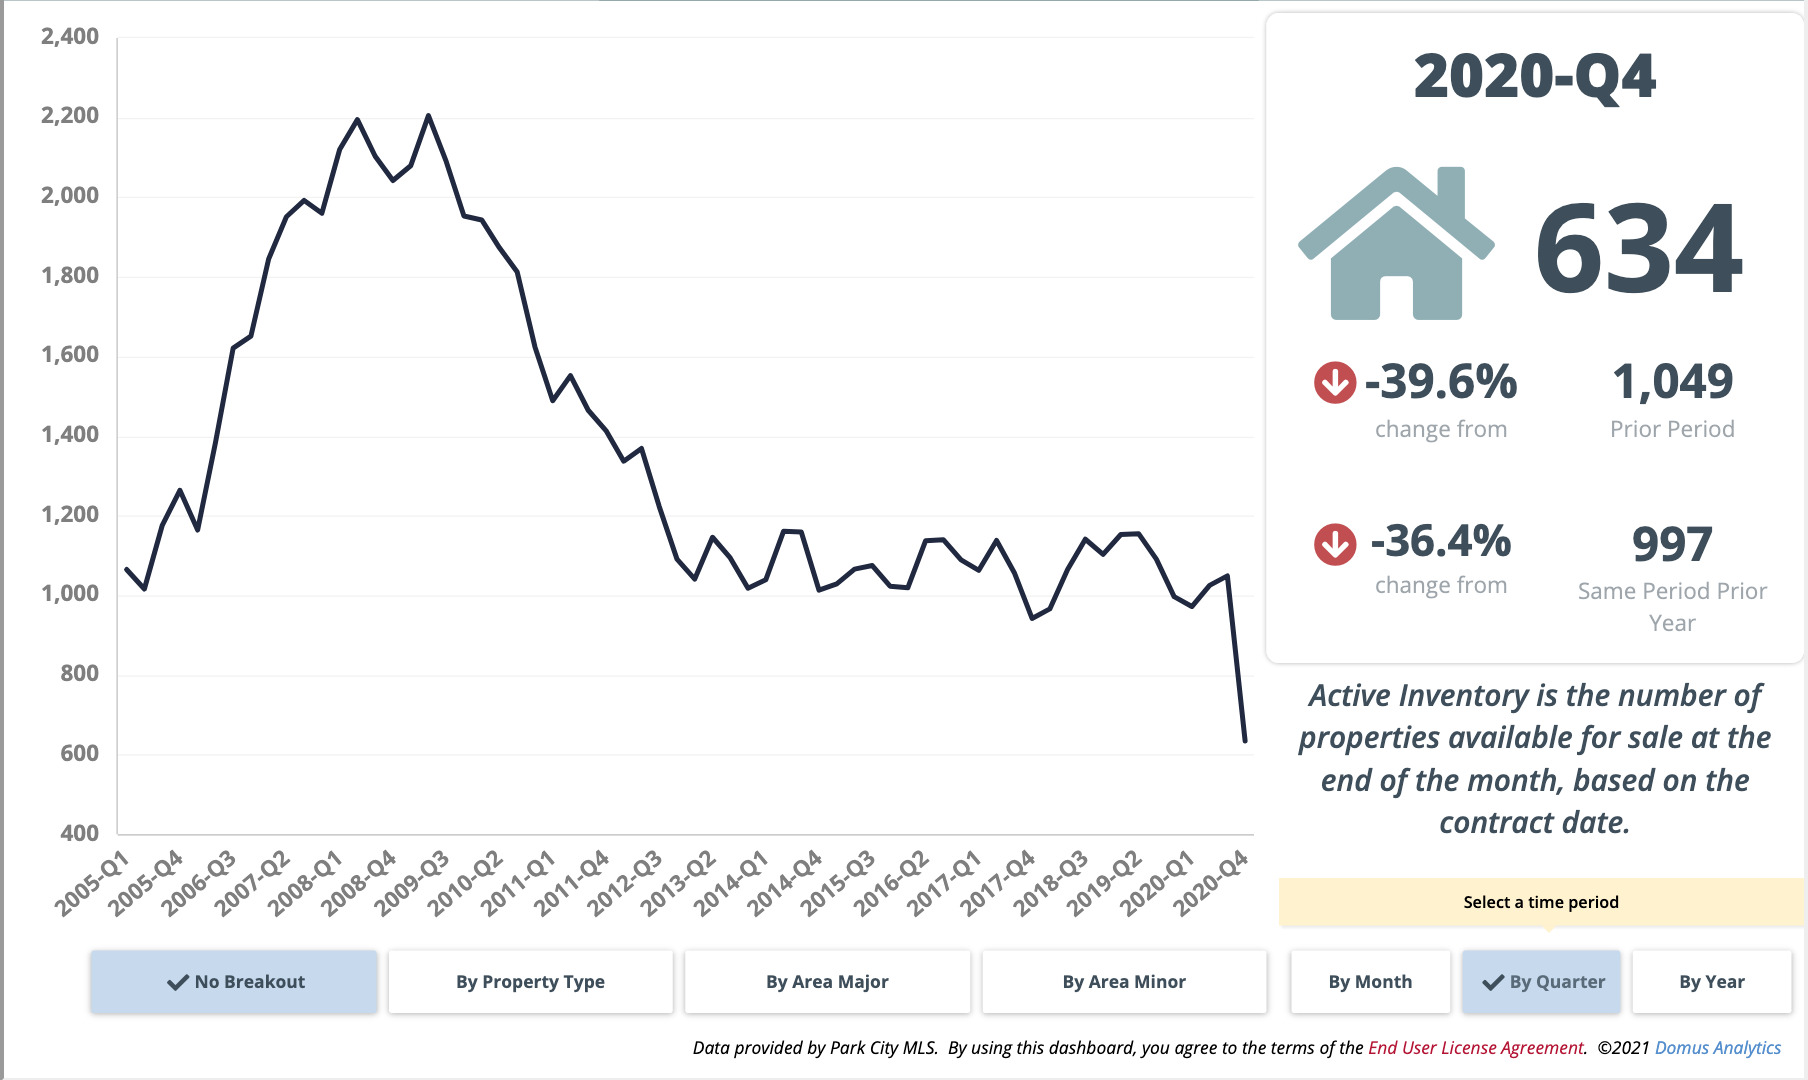
This is the top-down view; market activity sky-rockets leading to significant appreciation across the board due to increased demand. Buyers encountered multiple offer situations more frequently as inventory couldn’t keep up, and as a result, sellers were able to walk away with as much or more than they were asking for. Sellers could expect on average to get 97.4% of the list price of their property – this was the average for the entire market in 2020 – nary a deal in sight!
Looking at the Microelements
After taking a look at the market in a macro form it is time to shift to the microelements; I took the five most significant portions of the Park City market in both “Single-Family Homes” and “Condominiums” to illustrate what was happening on a micro-scale. You will find statistics and commentary related to these specific neighborhoods below, but here is the common thread: sales volume is up, average prices are up, and the average days on the market are down. Let’s get to it!
Park City Single-Family Neighborhood Statistics:
Park Meadows
- 2020 Closed Sales: 70—This is up from 60 in 2019.
- 2020 Sold Dollar Volume: $190,839,414—This is up from $129,869,000 in 2019.
- 2020 Average Sold Price: $2,765,789—This is up from $2,239,121 in 2019.
- 2020 Average Days On Market: 28—This is down from 51 in 2019.
Park Meadows is the model of consistency in Park City, regularly posting around 50 homes sold per year along with a standard appreciation of close to 7% year-over-year. The allure of Park Meadows comes from its central location, magnificent views, and well-constructed homes in a variety of styles and settings. It is likely that this neighborhood continues to see significant appreciation year-over-year because of extremely high buyer-demand, a number of renovations, and a continued lack of supply.
Old Town
- 2020 Closed Sales: 95—This is up from 49 in 2019.
- 2020 Sold Dollar Volume: $207,325,336—This is up from $93,480,691 in 2019.
- 2020 Average Sold Price: $2,253,536—This is up from $1,988,951 in 2019.
- 2020 Average Days On Market: 70—This is down from 125 in 2019.
“Old Town” refers to a couple of unincorporated areas surrounding Main Street and ranges from century-old miner’s cottages to stunning new construction. Old Town in 2020 had an interesting value proposition: buying a home in this area enabled folks who were planning on being in Park City for the short term to convert their purchase into an investment upon leaving. The access to Main Street and skiing make these properties very attractive rentals, and their central location makes them ideal for easy living. One note: the numbers above don’t take into consideration the numerous purchases that Tony Hsieh (former Zappos CEO, RIP) made – as many of these purchases were “off-market” properties. This area will be interesting to keep an eye on as folks decide to either live here full-time or part-time.
Jeremy Ranch
- 2020 Closed Sales: 62—This is up from 61 in 2019.
- 2020 Sold Dollar Volume: $83,278,100—This is up from $74,894,255 in 2019.
- 2020 Average Sold Price: $1,343,195—This is up from $1,227,775 in 2019.
- 2020 Average Days On Market: 20—This is down from 39 in 2019.
Pinebrook
- 2020 Closed Sales: 56—This is up from 43 in 2019.
- 2020 Sold Dollar Volume: $70,528,315—This is up from $51,918,780 in 2019.
- 2020 Average Sold Price: $1,259,434—This is up from $1,207,413 in 2019.
- 2020 Average Days On Market: 24—This is down from 35 in 2019.
I am putting Jeremy Ranch and Pinebrook together because outside of Promontory these two neighborhoods represent the largest portion of our primary home-buyer segment. Silver Springs contributes to this with similar average home prices and 32 homes sold in 2020, and Summit Park would contribute on the lower side of the average home price.
On its own the year-over-year growth in the average price is impressive—Jeremy Ranch with about $120k & Pinebrook with $52k growth—but it doesn’t tell the entire story. What I witnessed in 2020 was an increase in volume at the bottom of the price spectrum in these neighborhoods—think $900k homes—which is why the average selling price didn’t jump relative to the entire market.
The movers and shakers at the top of the market were tempered by the significant amount of homes that sold at the bottom of the market, maintaining the average. I think the compelling stat here is the “Percent of List Price Received” which for Jeremy Ranch was 98.3% in 2020. But if we break that down by Quarter we can see the COVID-19 impact. Q1 & Q2 were 96.8% and 96.4% but then the market came back to life with Q3 jumping to 98.6% and Q4 moving up to 99.1%.
I can tell you anecdotally this was courtesy of homes getting multiple offers and some selling over the list price. Pinebrook followed a similar trajectory but with slightly lower numbers: Q1: 96%; Q2: 95.4%; Q3: 97%; Q4: 98.4%. With easy access to Salt Lake City International Airport, Park City, and the surrounding areas will continue to be the hot commodity moving into 2021.
Promontory
- 2020 Closed Sales: 139—This is up from 79 in 2019.
- 2020 Sold Dollar Volume: $374,791,089—This is up from $176,961,841 in 2019.
- 2020 Average Sold Price: $2,735,701—This is up from $2,268,742 in 2019.
- 2020 Average Days On Market: 57—This is down from 92 in 2019.
The crown jewel of Park City—Promontory—as a neighborhood year-over-year represents the single most voluminous neighborhood segment in the Park City market. Promontory in my opinion is the best gated community the Park City area has to offer, with a diverse set of amenities it is sure to appeal to many types of owners. It has certainly come a long way from the humble golf community it began as in the early aughts.
Promontory usually has about a 40/60 split in primary homeowners vs. secondary homeowners. However, it appears that in 2020 the folks that owned these second homes decided to make them primary residences. Whether that narrative continues will be an interesting thread to watch for 2021.
Beyond the amenities, the types of properties available are numerous, which helps to facilitate the large sales volume. You can invest in a lot and build a home, you can purchase a custom-designed one-of-a-kind dream home, or purchase a vacation cabin that is adjacent to the golf course and their beach (yes, they built an actual beach). I would anticipate even more growth in the community in 2021 as options from the developer alongside re-sale become available.
Park City Condominium Neighborhood Statistics:
Old Town
- 2020 Closed Sales: 153—This is up from 133 in 2019.
- 2020 Sold Dollar Volume: $128,245,522—This is up from $105,380,182 in 2019.
- 2020 Average Sold Price: $849,308—This is up from $792,332 in 2019.
- 2020 Average Days On Market: 35—This is down from 51 in 2019.
Condo sales across the board took a while to pick up; the lowest inventory and sales are usually in Q1—this is the time when folks are taking advantage of ski vacation rentals and Sundance so we usually don’t see listings in this time frame. The COVID-19 lockdown in Park City occurred in the middle of March and gave owners pause. “What would the market do?” they asked. “How long would this be around and would rentals be impacted for the winter of 2020?”
Early on, the story I heard consistently was that owners were going to hold. The investment they made was still strong, they could afford to take a hit of lower rental revenue since they were not over-leveraged, and felt that 2021 would see a return to the status quo. We can see this since Q1 & Q2 combined for 42 of the 153 total sales.
Q3 rolls along and people cannot get enough of ski properties in Park City and they start flying like hotcakes with 51 units moving, and in Q4 that only increases to 60. Not everyone moving to Park City needs to have a large single-family home, there are plenty of individuals and couples that can take advantage of the smaller spaces for the time being and convert these properties to rentals for next season. Demand is unlikely to falter as we push ahead in 2021.
Lower Deer Valley (Snow Park Village Area)
- 2020 Closed Sales: 52—This is up from 42 in 2019.
- 2020 Sold Dollar Volume: $59,398,801—This is up from $48,340,000 in 2019.
- 2020 Average Sold Price: $1,142,285—This is DOWN from $1,150,952 in 2019.
- 2020 Average Days On Market: 19—This is down from 64 in 2019.
Upper Deer Valley (Silver Lake Village Area)
- 2020 Closed Sales: 62—This is up from 44 in 2019.
- 2020 Sold Dollar Volume: $148,523,500—This is up from $92,843,134 in 2019.
- 2020 Average Sold Price: $2,395,540—This is up from $2,110,071 in 2019.
- 2020 Average Days On Market: 44—This is down from 100 in 2019.
Deer Valley was an interesting case study this year. Much like Old Town, the first two quarters are usually low, especially since these are all ski properties—and frankly, people were reluctant to list. Let me tell you a story, though, that captures the essence of 2020. In 2019, my partner Nancy Tallman sold a Stonebridge Condo to a client of hers. He closed in September of 2019 for $1,070,000. Move forward to the summer of 2020 and he reaches out and asks about what he could get for it and we do a market analysis: he could list for between $1.25-1.3m. He obviously jumps.
Well, after multiple offers we close at $1.325m—about 1 year after he purchased for $255,000 less. This was not the exception. This was the rule. Currently, there is a Pinnacle townhome under contract with a list price of $1,899,000. In 2019 these townhomes would struggle to hit $1.4m, so what gives? Too many buyers, not enough inventory. I anticipate we will see new benchmarks develop with properties in Deer Valley, however, they have not developed as of yet, with properties continuing to set new highs.
Prospector
- 2020 Closed Sales: 58—This is down from 60 in 2019.
- 2020 Sold Dollar Volume: $18,647,550—This is up from $15,254,200 in 2019.
- 2020 Average Sold Price: $321,509—This is up from $254,237 in 2019.
- 2020 Average Days On Market: 21—This is down from 25 in 2019.
I get asked about which segment of the market did the best in 2020, and my answer has been: all of it, top to bottom.
Prospector Village is representative of the entry-level of the Park City market, with some of the most affordable condos in Park City. These are incredibly popular because it gives folks an opportunity to own a property centrally located in Park City for under $400k—and not just a studio. We are talking 2BD/2BA, on major transit routes and in an extremely walkable area.
As a result, the average sales price skyrocketed 26.4% year-over-year. These were extremely popular with younger folks moving out of a major metropolitan area on a temporary basis: move to Park City and live there until COVID dies down and then convert into an investment property. A project like New Claim is still one of my favorite investments in town, with the ability to get 2BD/2BA and close to 1000 sqft of space and the ability to generate a sizable chunk of rental revenue for under $400k. It is tough to beat!
Canyons Village
- 2020 Closed Sales: 262—This is up from 217 in 2019.
- 2020 Sold Dollar Volume: $227,169,867—This is DOWN from $268,808,082 in 2019.
- 2020 Average Sold Price: $867,061—This is DOWN from $1,244,482 in 2019.
- 2020 Days On Market: 7—This is down from 61 in 2019.
The story of Canyons Village is certainly “Days On Market.” Really the other stats are skewed by YotelPad which was completed in October—84 units closed with an average sale price of $378,000. That will certainly counter the top segment of the area and bring numbers down.
Demand was through the roof, which is evident by units staying on the market an average of 1 week. We just witnessed The Ascent (information below in the newsletter portion) sell 64 units in 5 days. That project is over 50% sold out and has been available for less than a week. That said, the Canyons Village is finally coming together, and once Pendry is complete it will feel quite different than it did just a year ago. With a small number of developable parcels left—earmarked for convention and luxury hotels—the area is feeling more complete and will be one of the hallmarks of Vail’s portfolio.
Are We In a Bubble?
Now to shift gears. A prominent question frequently asked to me is: “are we in a bubble?”
I chose to highlight these areas in Park City because it illustrates the narrative of the market in 2020 and provides insight into what might happen in 2021. Now, on to the question of a bubble. Traditionally a real estate bubble develops when folks invest in an area based on speculation that demand will outstrip supply for a period of time. The entire investment is predicated on the idea that there will be capital gains realized due to the supply and demand falling out of equilibrium.
A real-life example of that was in Park City in 2006/2007. Folks were getting money for next to nothing and investing in projects like St. Regis, Waldorf Astoria, and Empire Pass. All ski properties promised to be great investments because you could put almost nothing down and pay them off with rental revenue.
Next thing you know the economy implodes and it takes a decade before St. Regis and Waldorf Astoria prices reach their value when initially offered. There are still units in Empire Pass that only in the last few months finally reached their sales price from 2006/2007.
How is right now different? Current buyer demand is not predicated on speculation. It’s based on true demand for a good—a significant life event has occurred—work from home, schools closing, change of career, you name it. People are moving here and buying a property because it is a need more than a want, and folks who are already here are reluctant to let go.
To borrow from industry insider Rob Hahn:
I mean, we already know that most people don’t sell their family homes for the hell of it.
Supply is predicted to remain limited in 2021 because those folks who are already in Park City do not have somewhere else to go, and if they want to remain in Park City they now have to compete with those same cash buyers from out-of-state ready to make a move. At the end of the day, I cannot predict the future. But again, all indications point towards limited inventory in 2021 and a highly competitive market across the board, the likely result of which is continued appreciation in Park City.
1 Comment
Great analysis!
For future years please include SkyRidge and Hideout as “Park City Adjacent” in your 2021 reports (which will be primarily land) and resales in 2022 and beyond. Thanks