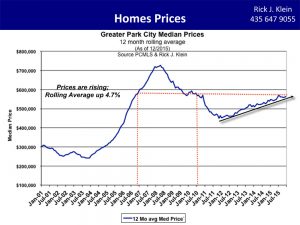
 This article, written by National Association of REALTORS Chief Economist Lawrence Yun, was published on Forbes.com last week. I have been writing about low housing inventory in Park City over the last several months. Dr. Yun explains the reasons for the housing inventory issue nationwide, and in my opinion, gives great perspective into the Park City housing market. Spoiler Alert: prices are going to keep rising. The graph above represents median single family home prices in the Greater Park City area. As you can see, overall, prices are still below the height of the market in 2008. However, the overall median price can be misleading as some neighborhoods have already surpassed 2008 prices. Contact me for more details.
As Stocks Swoon, Home Prices Accelerate Upward Again
 The stock market woke up on the wrong side of bed this year, suffering a 10% correction. But home prices, another important asset for many families, look to be reaccelerating. The national median home price increased 7.6% over the past 12 months to December 2015. Other home price data show similar strengthening in their respective measures to either the fastest rise of the year or nearly so: the CoreLogic home price index increased by 6.3% in December while the less timely home price data from the Federal Housing Finance Agency rose 5.9%, and the Case-Shiller index rose by 5.8% to November.
This reacceleration in home prices is somewhat surprising given that there had already been sharp rebound growth of above or near 10% in 2013. Prices then slowed, though remained at a strong, upper single-digit rate of appreciation throughout 2014. It was easy to project for 2015 that the housing market would normalize, with steadily rising housing supply meeting steadily rising housing demand, and would therefore result in a more normal rate of price growth of around 4%. It was trending down to this historical price growth rate in the earlier part of the year, but the year-end data clearly show the normalization was short-lived and that the market appears to be heating up again.
This reawakening of home prices is coming at the wrong time, when stagnant wages persist, and hence it is cutting into housing affordability. Should mortgage rates rise – so far luckily the rates have been behaving with no real change since the Fed’s rate hike in December – then affordability will face even more challenges in the months ahead. A 100 basis points rise in rates (say from the current 3.8% to 4.8%) requires an additional 9% in monthly mortgage payments.
Why are the prices reaccelerating? It’s a simple case of insufficient supply to meet demand. At the end of December there were 1.79 million homes available for sale, down 3.7% from an already low level one year ago. Moreover, due to the higher-than-normal sales pace in December, when the weather was unseasonably warm, the supply-demand balance measure of months’ supply fell to 3.9 months. In other words, at the current sales pace, the entire inventory would be exhausted in 3.9 months, one of the thinnest levels of inventory recorded in the past 15 years. By comparison, a balanced market would correspond to around 6 to 7 months’ supply. When home prices declined during the market crash, the months’ supply was surging above 10 months.
Why is there an insufficient supply then? Well, it’s simply a matter of insufficient new home building over multiple years. From 2009 to 2015, a total of 5.6 million single-family homes, condominiums, and apartment units have been built. Over the same period, approximately 1.7 million housing units were deemed uninhabitable or obsolete and were demolished and removed from the housing stock. These two figures yielded a net addition of 3.9 million housing units to the country’s stock. Over the same period, America’s population rose by over 17 million. Even if factoring that there are on average 2.5 persons living in one housing unit, about 7 million new homes would have been required.