The first quarter of the year usually flies under the radar; both residents and visitors to Park City are busy skiing and taking advantage of winter, and with the school calendar, making any significant moves can be challenging. Undoubtedly, people were busy skiing this year, considering we broke every snow accumulation record in the state, yet activity overall was up over the previous quarter – let’s get into it.
Historically low interest rates over the last few years were followed by an historically steep interest rate hike during the second half of 22 creating “golden handcuffs” or a “locked in effect” for owners unwilling to trade their low rates for higher ones. I mention this because we could be in for a new normal regarding the Park City real estate market.
From 2013 to 2020 the average amount of properties listed for sale at a given time was about 1200. After the post-Covid real estate spike, we hit a record low of 341 properties listed in Q1 of 2022. With such low inventory, we saw a rush of listings in Q2 followed by lower demand due to rising interest rates. Inventory peaked in Q3 of 2022 with 684 properties listed before it began to slide. Fast forward to Q1 2023, when our inventory total was 497. While we are likely to see an increase in this level, we are perhaps entering a new normal which could take years to replenish inventory to previous levels, and, maybe, without robust development, may never get there.
Inventory in Q1 was down 17.9% from the previous quarter. Only 252 new listings entered the market across the first three months of the year, historically the lowest amount ever in a single quarter. Lower inventory may be the new normal, and if so, pricing should remain strong. In fact, both the Median and Average Sales Prices in Q1 set new highs.
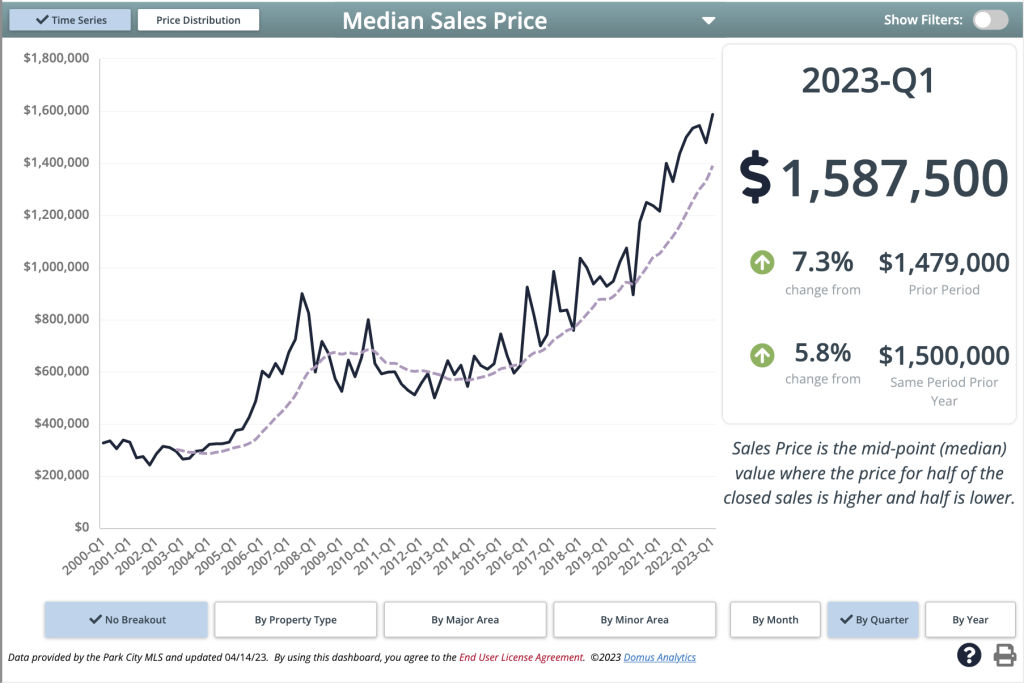
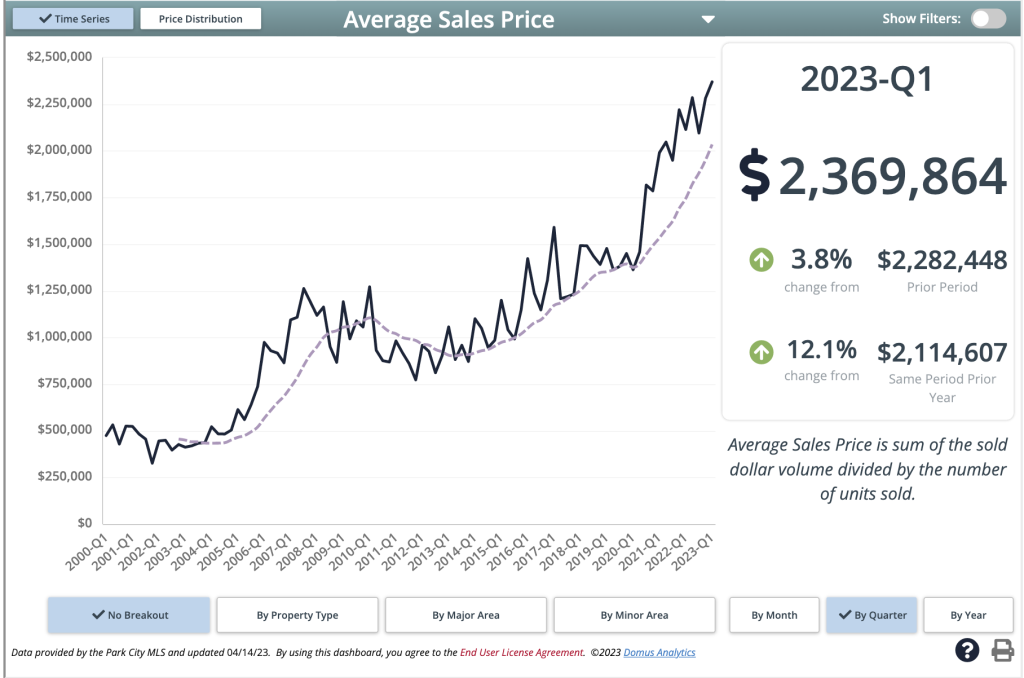
Park City remains highly segmented and nuanced, as with any real estate market. Overall, pricing in the market is relatively healthy though some subdivisions are certainly doing better than others. I am reminded of Warren Buffet when looking at property in Park City. His advice was always to identify the best companies and hold them for a long duration to develop wealth long-term. I wholeheartedly believe that Park City compared to other markets is a “blue-chip stock” worthy of holding. With the investment in infrastructure and diversity of business in Utah, along with the potential of another hosting gig of the Winter Olympics, I believe the long-term prospects of our market are excellent.
Buyer demand is on the other side of the axis, and attempting to quantify that is a tall order. We saw an 18.9% increase in Pended Sales from Q4 showing that more buyers were active in a market with less inventory. There is a narrative that buyers are willing to wait and are looking for deals, which we can see in the Median Days On Market and Percent Of List Price Received.
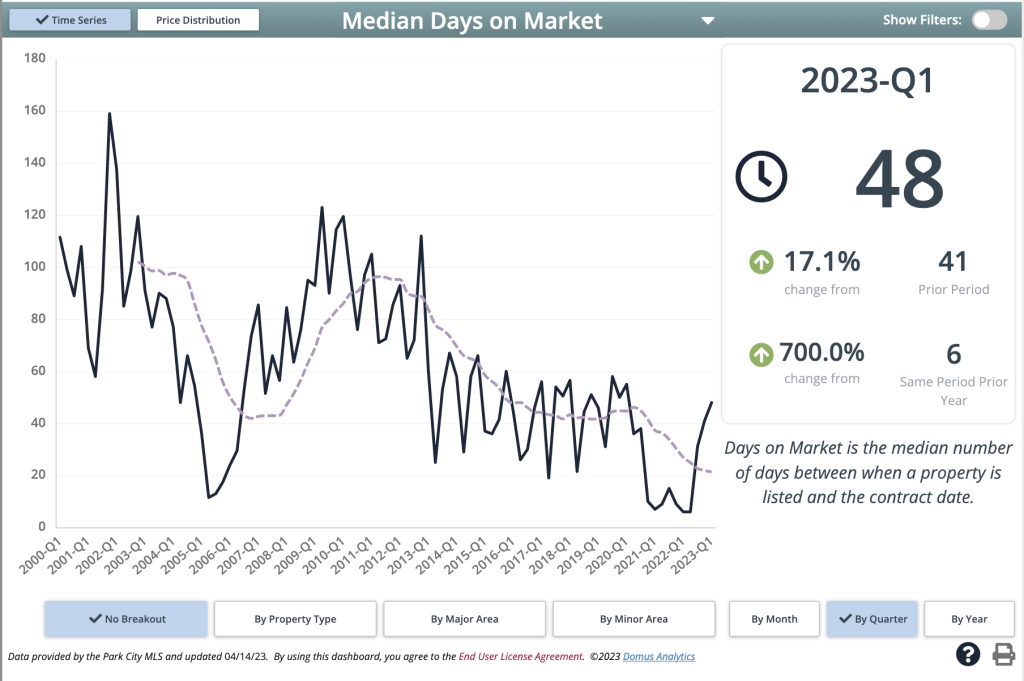
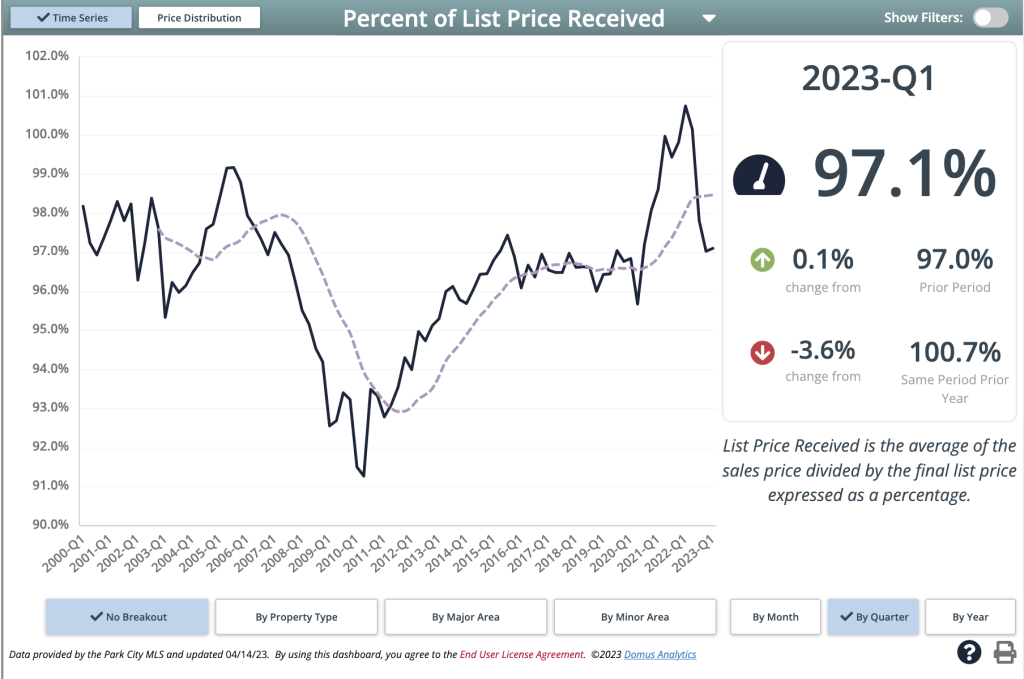
48 Days and 97%.
Buyers are more selective about the properties they purchase and negotiate more than they did in recent years. Days on market is an exciting metric because it doesn’t necessarily tell the story about buyer demand as much as it speaks to the total buyer pool. As prices increase, so too do the days a property will spend on the market because there are fewer available buyers as prices rise. That said, it would appear that the velocity of the market is moving toward what I would consider to be average. However, the velocity can still be aggressively quick; take a look at this:
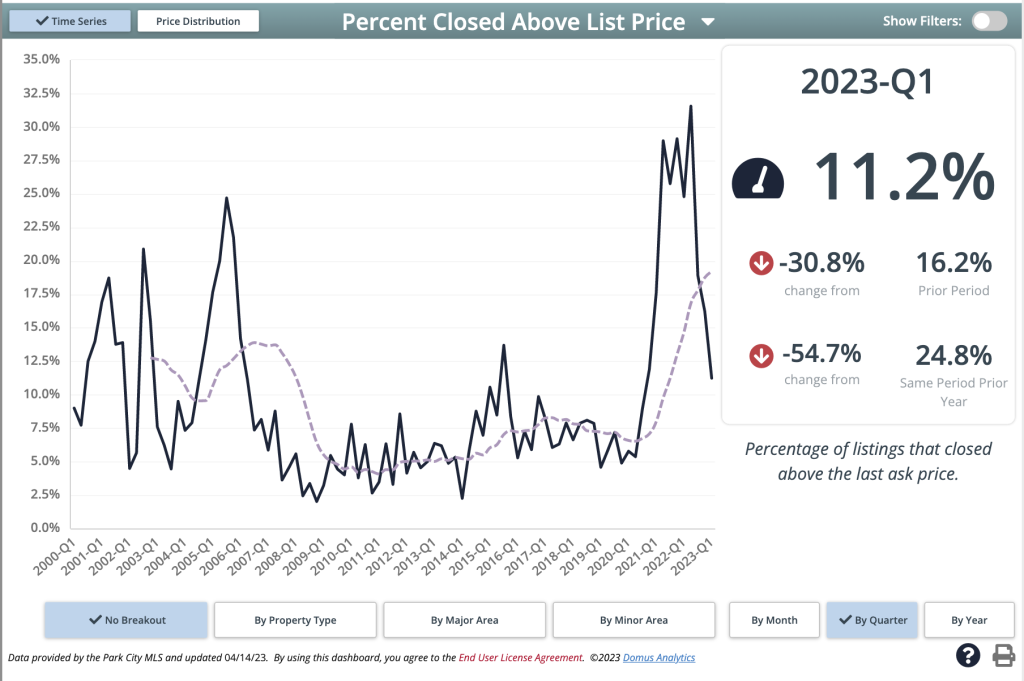
11.2% of properties still closed above the list price in Q1. Because inventory was low and buyer demand was still robust, specific properties received a buzz of activity. The takeaway for buyers is that while, yes, you have more time and negotiation space, appealing properties will still move quickly. For sellers, presenting your property in the best light possible will help maximize attention and sales price – this is a beauty contest. Those sellers that put in the work see the reward.
Interest rates are the most significant impact on buyer demand in any real estate market. Interest rates have decreased since they spiked in March, leading to more buyers applying for mortgages and increasing purchasing power. According to CoreLogic, the real estate market has bottomed out. Take this with a grain of salt, but as with any market, human emotion and narrative are prominent driving factors. General sentiment will only improve if more outlets come to the same conclusion.
Looking at these two data points together suggests we will not see a significant drop in buyer demand anytime soon. The data from Q1 seems to correlate with the idea that we may be entering our new normal with inventory, pricing, and demand stabilizing.
Let’s take a look and see how this Q1 compares to the previous two years:
| Park City Limits | Q1 2023 | Q1 2022 | Q1 2021 |
|---|---|---|---|
| Total Sales | 58 | 107 | 203 |
| Median Sales Price | $2,297,661 | $2,230,000 | $1,750,000 |
| Days On Market | 70 | 6 | 19 |
| Price/SQFT | $1011 | $1044 | $779 |
| % Of List Price | 96.5% | 100.6% | 98.1% |
| Snyderville Basin | Q1 2023 | Q1 2022 | Q1 2021 |
|---|---|---|---|
| Total Sales | 120 | 264 | 199 |
| Median Sales Price | $1,300,000 | $1,395,000 | $895,000 |
| Days On Market | 46 | 6 | 4 |
| Price/SQFT | $634 | $967 | $516 |
| % Of List Price | 97.4% | 100.8% | 99.1% |
| Jordanelle | Q1 2023 | Q1 2022 | Q1 2021 |
|---|---|---|---|
| Total Sales | 65 | 73 | 69 |
| Median Sales Price | $1,122,383 | $1,023,700 | $759,000 |
| Days On Market | 11 | 5 | 2 |
| Price/SQFT | $491 | $525 | $346 |
| % Of List Price | 100.9% | 102.8% | 101.5% |
| Heber Valley | Q1 2023 | Q1 2022 | Q1 2021 |
|---|---|---|---|
| Total Sales | 45 | 81 | 68 |
| Median Sales Price | $995,000 | $950,000 | $806,817 |
| Days On Market | 33 | 8 | 14 |
| Price/SQFT | $363 | $342 | $260 |
| % Of List Price | 96.2% | 101.1% | 99% |