My partner Justin Altman’s analysis of the first quarter of 2021 real estate statistics was so popular that I asked him to contribute an analysis each quarter. I loved reading this as the numbers back up my experience in the trenches. This year has been a crazy one; however, the market seems to have shifted around early July, at the start of Quarter 3. Could some opportunities be opening up for buyers? Read Justin’s analysis to find out!
A year ago, on March 23rd, 2020, Summit County initiated the “stay-at-home” order that we anticipated would last 14 days in an attempt to “flatten the curve” – well, 490 days have since passed, and life as we know it has likely changed permanently. Describing the contrast between Q2 2020 and Q2 2021 from a real estate perspective is a lesson in hyperbole! The difference is so stark that it is far more helpful to compare Q2 to our previous three quarters and look at our rolling 12-month averages. Truthfully we are operating in a market that has no historical precedent. As such, we are in uncharted waters trying to glean some insight!
In a way, I feel like a broken record: “The real estate market in and around Park City continues its robust bull run with no slowing down in Q2!” This sounds familiar, right? This has been the trend for nearly 12 months, with a significant acceleration in January 2021, but is there an end in sight? I will indulge you in some informed speculation after going through these previous quarters and seeing what trends are emerging.
Top-Down View of the Greater Park City Market for Q2 2021:
– 453 Total Closed Sales and $919 million in Closed Sales Volume
- This is up 15% from Q1
– 476 New Listings
- This is down nearly 15% from the previous quarter, but it is right on the trendline year-over-year.
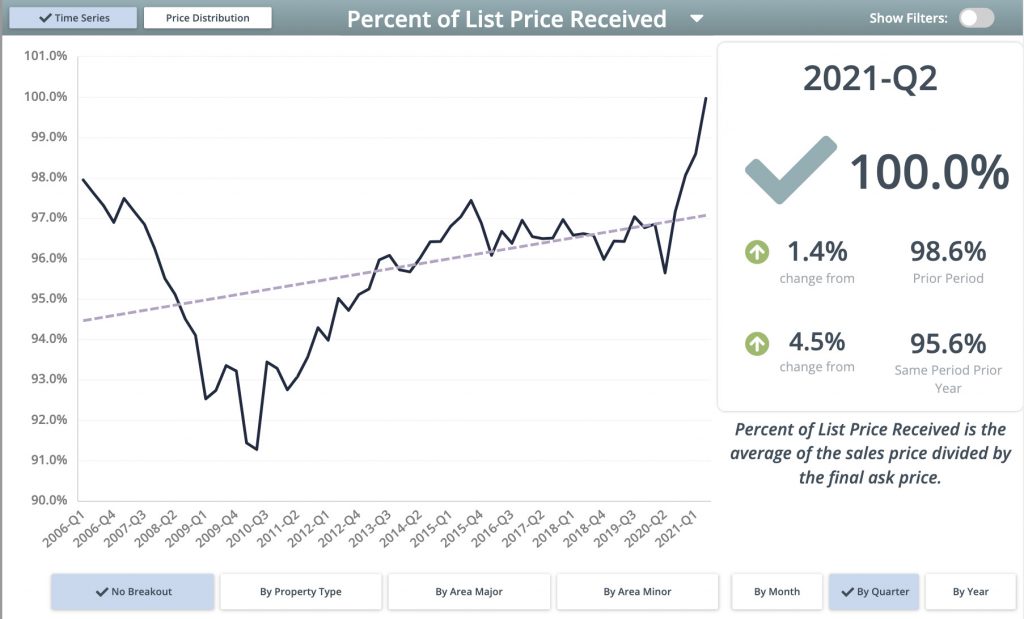
– Percent of List Price Received: 100%
- For the first time ever, Q2 featured a 100% percent of list price received, which is up from the previous high of 98.6% in Q1 of 2021. Now, this doesn’t mean that every property got full list price, but it suggests that properties that traded under list price were offset by properties that sold over list price, averaging out to this number. Over the last few months, when my buyers have asked what we should come in at on an offer, I always tell them the list price is the lowest offer we can make – I suppose I was not alone in that advice!
– New Contracts Written: 435
- This is down nearly 23% from Q1 – this will be important later – but is still up 53% year-over-year. If the quantity of new contracts written goes down and inventory goes up, we will start to see more balance.
– Single-Family Sales in Park City: 175
- This quantity is more akin to our historical Q3 sales numbers and matches some pre-covid quarters. That said, Q2 tends to be the warm-up show, while Q3 is the main act. We could postulate then that Q3 will see higher sales volume as it is “selling season.”
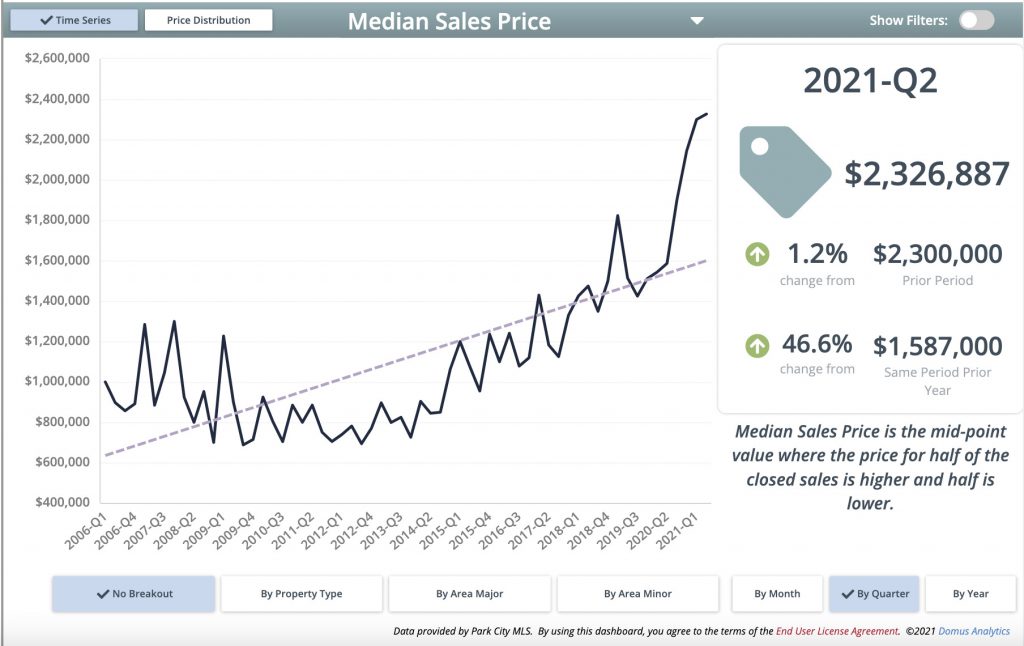
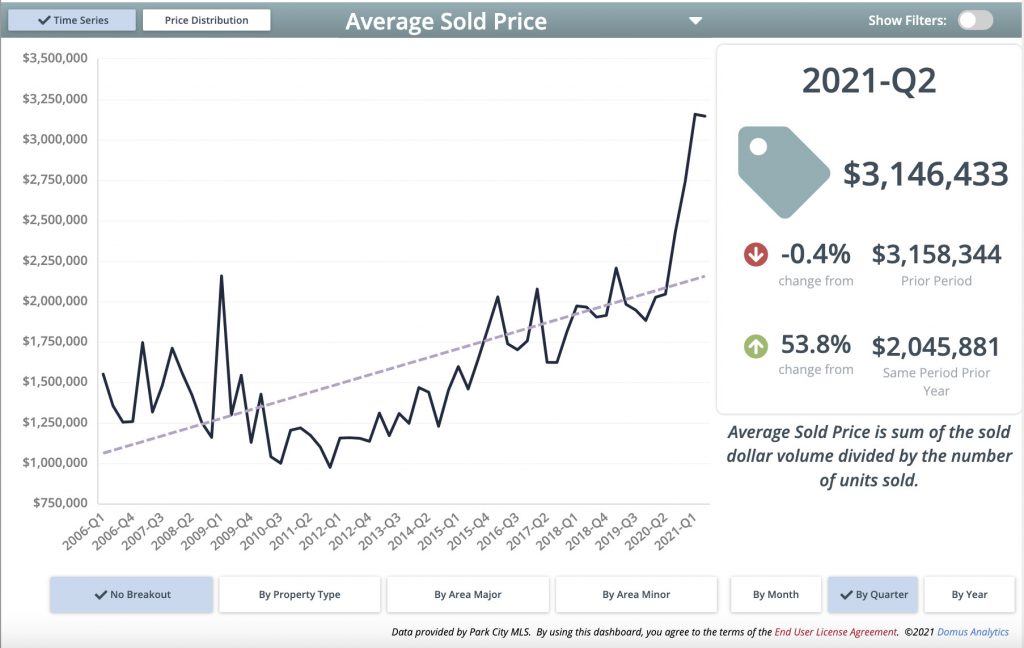
– Single Family Median Price $2,236,887 & Average Price $3,146,433
- Both of these are up nearly $1 million over the previous year – now it is essential to keep in mind that these are numbers for the entire Park City market, and as you will see below, a neighborhood like Promontory is likely to skew these numbers higher – the vital thing to look at here is the increase in number values and to recognize that all properties have risen, some more than others.
– Condominium Sales in Park City: 278
- This is up 10% over Q1 and is still well above any of our previous highs historically. There is some anecdotal evidence to suggest as people are migrating due to Covid, some folks are looking for properties they can live in temporarily and then rent once a return to a major metro becomes more palatable.
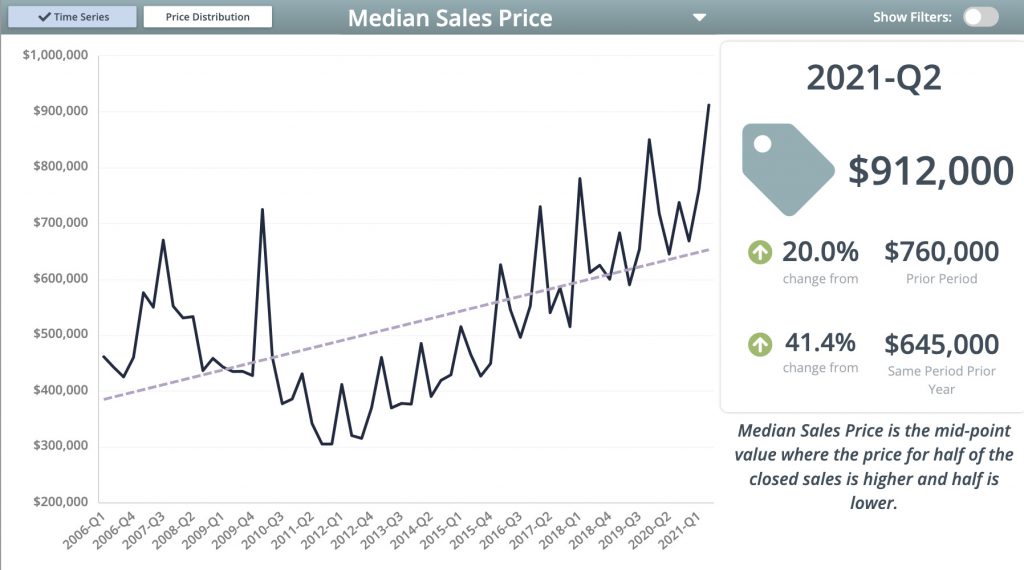
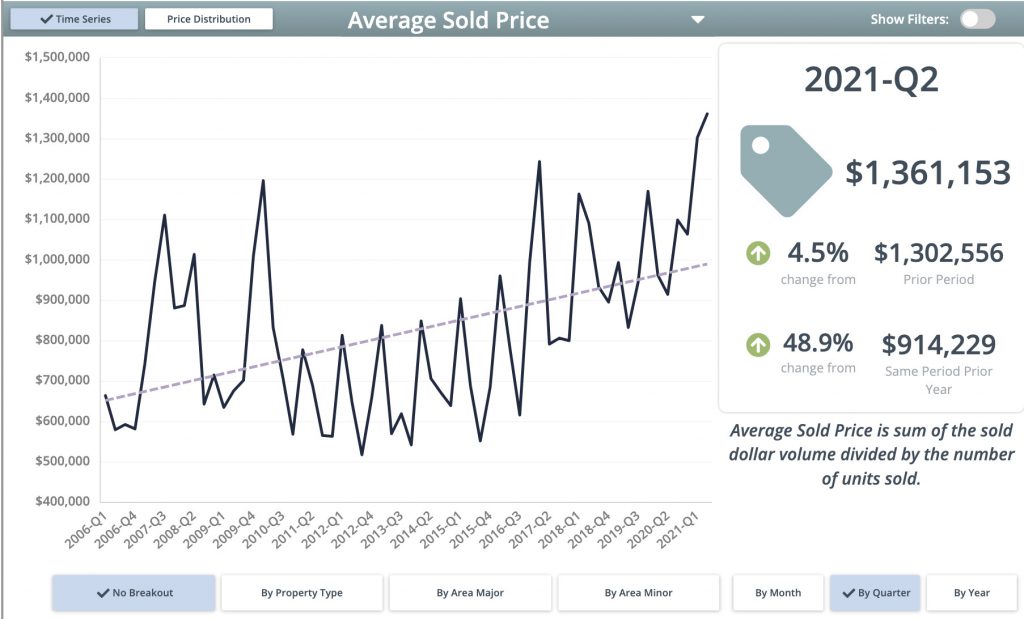
– Condominium Median Price $912,000 & Average Price $1,361,153
- These numbers are not quite as drastic as the Single Family homes but still represent significant growth. It is important to note that historically speaking, the average and median prices for condos tends to skew when a significant project closes – and it can skew both directions. A major project at Deer Valley with an average price point over $2 million will push numbers up, while a project like YotelPad with average sales prices in the low $300’s will drive that number down. It is more important to dig deeper into condos because of the increased nuance.
*An important note before we continue: when I refer to a year, I am referring to the “rolling 12-months,” so 2020 means 7/1/19 to 6/30/20 and 2021 means 7/1/20 to 6/30/21.
Single Family Homes
Let’s look at single-family homes as there is a bit more meat to these bones; our two zip codes will split these: 84060 represents Park City Proper, and 84098 represents the Snyderville Basin.
Single Family Homes in Park City Proper (84060)
Year-over-year, Park City Proper featured a 37% increase in median sold price to $2.75 million, and sold inventory increased anywhere from 85% to 800% depending on the neighborhood. Now that stat line is impressive but can be misleading. Let’s dig into this a bit further.
– “Old Town” is the area surrounding Main Street and Park City Mountain; it has always been a popular spot, but it took off last year. In 2020 the area recorded 49 sales, and in 2021, that number increased to 130!
That is a 165% increase in sales year-over-year. Not too long ago, the absorption rate in Old Town was close to 2 years!
– That 800% increase in sales year-over-year?
That occurred in a small neighborhood called the Aerie. The number sounds impressive until you realize that there were only 2 sales in 2020 compared to 18 sales in 2021. I would argue that while the increase is somewhat hyperbolic, it goes to show that we genuinely have had more inventory available than ever before. It simply gets scooped up quite quickly.
– Park Meadows is the bell-cow of Park City, one of the oldest and most desirable neighborhoods. It tends to be an excellent barometer for the city. Sales volume increased by 141% and the median price increased by $700,000 year-over-year.
Are there limits to this demand? The short answer is “probably”. Old Town in Q2 featured 20 sales, and Park Meadows featured 10 sales – to replicate the sales volume we witnessed over the last 12-months would take mammoth efforts, which, while not impossible, are improbable. The other intriguing thing to note is how the top end of the market was indeed the winner.
Looking at the numbers for the “Prospector” neighborhood, we have some interesting anecdotal evidence about the perceived shift in Park City. “Prospector” has always been an “economical” option in Park City, with homes that were seen as more affordable albeit a bit older. The majority of homes in this neighborhood were and are primarily working-class homes. Now, the market and location may have pushed those prices well out of “working class” budgets. Still, by and large, they are not comparable to the more luxurious homes of the surrounding neighborhoods. 2020 featured 19 sales, and 2021 featured 18 deals – it’s the only year-over-year sales volume decrease in any neighborhood in the greater Park City area. A typical question sellers have asked is, “where will I go if I sell?” I think this was especially true for the residents of Prospector. Based on the neighborhood’s price point, there are no replacement properties in the same price range in the city, meaning anyone who sold was either moving up by a large margin or leaving town, and not too many folks decided to up and leave Park City in the last year. I think it shows that while the entire market has been impacted, there are specific segments that have felt it more than others.
Single Family Homes in Snyderville Basin (84098)
Moving right along to the Snyderville Basin, the immediate picture is a bit more modest, making sense. The diversity of neighborhoods in this area is relatively robust. Let’s get right into it, starting with our perennial favorites: Jeremy Ranch and Pinebrook.
– Jeremy Ranch 47 sales in 2020, 86(!) in 2021 – and the average price of a home went up 23%.
– Pinebrook 37 sales in 2020, 62(!) in 2021 – and the average price of a home went up 23%.
– The juggernaut known as Promontory would like to remind you that it is the king of Park City. 74 sales in 2020, 161 sales in 2021. $185 million in sales volume in 2020 to $470 million in sales volume in 2021. Average home price increased by $420,000. The people have spoken, and they love Promontory – now the question will be, do folks hold onto these long-term as second properties when they return home?
That will be an exciting question moving forward over the next few years.
The Condo Market
I wanted to focus on Single Family homes because Condominiums have a bit more nuance to them, and with a couple of new projects, some of the numbers tend to be a bit skewed. That said, condominium demand is still at an all-time high, with pricing continuing to go up.
The summary is that more condos have sold at higher prices across the board than we have seen historically. The Canyons Village sold 348 in the last 12 months, which is massive. Pinebrook, Kimball Junction, Bear Hollow, Deer Valley, and Old Town have doubled the units sold year-over-year, with average prices increasing by 30%. If you are curious about a specific project or area and want a more detailed condominium analysis, please reach out!
What’s Going to Impact Our Market?
On to my favorite part – informed speculation!
There is a lot of speculation of a rate increase in October, coupled with some government programs ending at the same time. Quite a few industry folks are looking at late fall/early winter as the shifting point. I don’t necessarily disagree with this. Low rates will always encourage buying, especially when they are lower than the rate of inflation – but the rate increase will still leave mortgage rates meager, especially relative to historical precedent. The government assistance ending is a curious one. Because of the enormous wealth in Park City, many folks did not qualify for aid or get to take advantage of these government programs – will it impact the Salt Lake City market? Indeed, the average price of a home in Salt Lake Valley is significantly lower than in Park City. This does not make Park City immune or insulated, but those two items are less likely to influence our real estate market directly.
I think we are more likely to see a shift if and when COVID subsides – with the delta variant continuing to grow, we could see another spike in migration out of restrictive states even with vaccinations – and we may see work-from-home measures extended. I believe the most significant influence right now is work-from-home policies by large corporations. If more companies announce that work from home is permanent or a hybrid model is available, I think migration to Park City will continue for at least another year. If more companies reverse their stance on those items, we will see the buyer pool revert towards the mean sooner, which could slow the market from its torrid pace.
At a certain point, we will see more inventory and fewer buyers, which will bring balance back to the market. Q2 showed us that fewer contracts were written than previously. If Q3 can provide an influx of new listings at a rate higher than contracts written, we may start to see that shift. But there are other indicators, like average days on market (7) and percent of list price received (100%), which show the velocity of the market. My take is that buyers will have more options now than they have had over the last 12 months, albeit at higher prices. We are starting to see price reductions on listings again and the expiration of listings which I think is healthy for our market. We are still a long way off from our “normal,” but at least we are no longer moving at a breakneck pace necessarily.
If there is a topic you want to dig into a bit further or an area that was left off that you are curious about, please reach out, and we can discuss it at length!
Thank you!