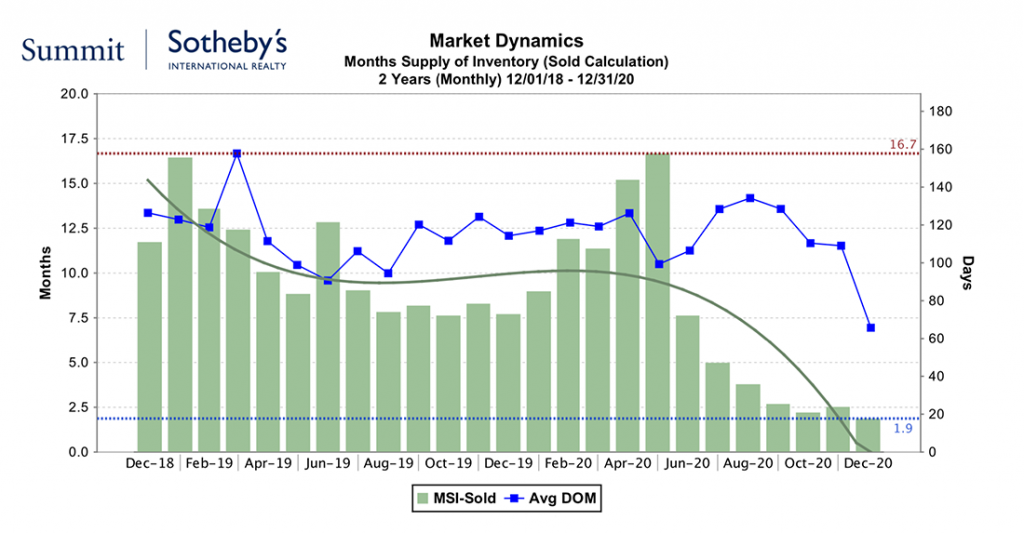
This chart, which illustrates Months Supply of Inventory and Days on Market, will tell you everything you need to know about the Park City real estate market.  Inventory of homes has sunk from about 70 days a year ago, to 20 days right now. What this means is that there are fewer properties available to buy creating a strong Sellers Market.
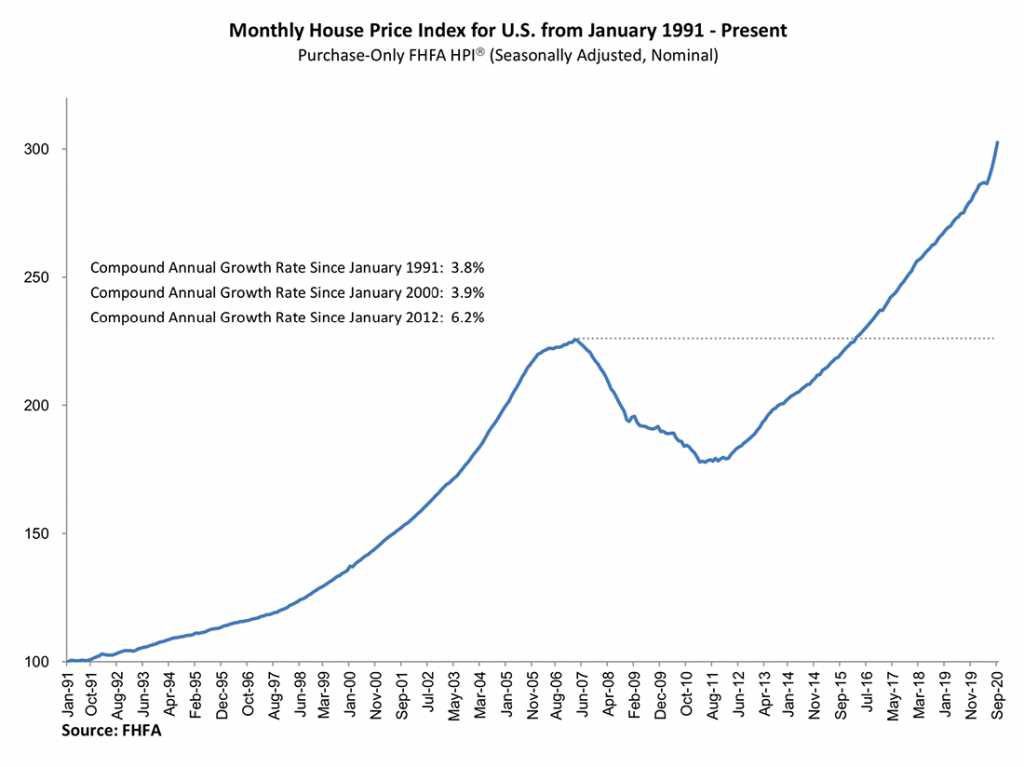
The Federal Housing Finance Agency (FHFA) released its latest housing trends data a few weeks ago. According to this report, “U.S. house prices rose for the fifth straight month since states re-opened their local economies,” said Dr. Lynn Fisher, FHFA’s Deputy Director of the Division of Research and Statistics. “The 12- month gain of 10.2 percent in October is the highest annual appreciation observed since the 2004- 2005 period. Extremely low mortgage rates and a limited supply of homes for sale continue to propel price gains. The data do not yet reflect renewals of some local and state COVID-19 restrictions.”
Clearly, trends in Park City are not an anomaly but are in alignment with the rest of the nation. The housing price index creates a nice visual of national historical price trends.

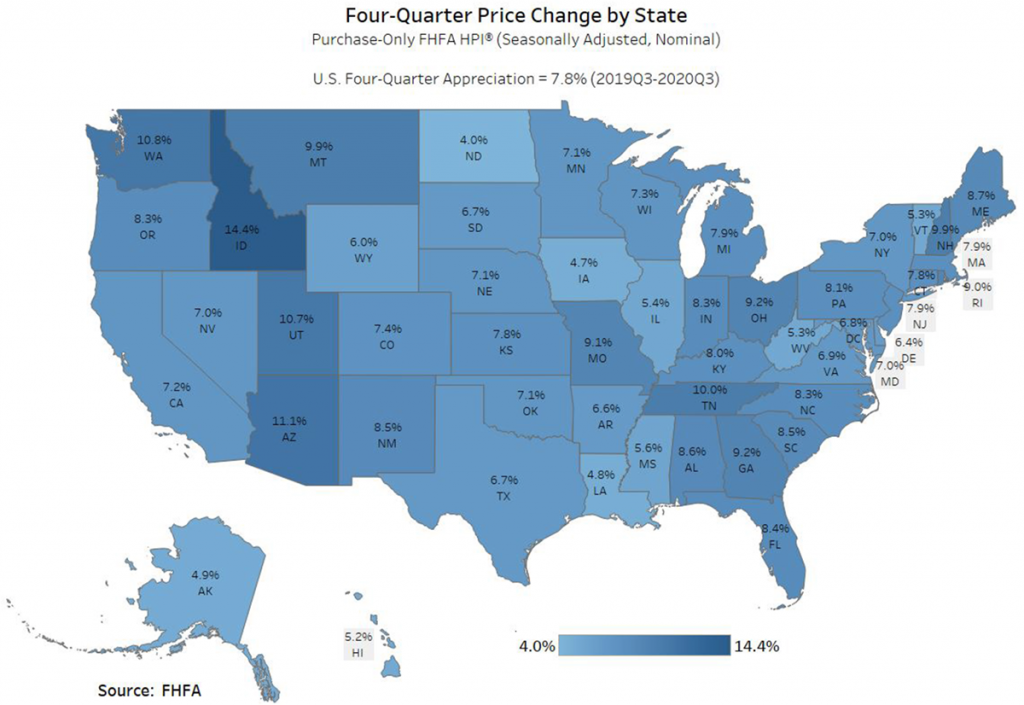
Utah’s housing appreciation (10.7%) is greater than the national appreciation of 7.8%. According to multiple sources, Utah has had the best job market in the United States for several years. In Park City, the average sale price was up 9.6%.

Park City is not in its own real estate bubble but is part of a national trend of lower inventory of homes and home appreciation.
Strategy in Today’s Unique Market
 The current market requires expert buyer representation as many homes are selling off-market or in multiple offer situations. Buyers need to have proof of funds on hand or be pre-approved and ready to make aggressive offers once the right property materializes.
I recently created a Real Estate Buyer Guide to help buyers understand our real estate market. Take a look at the guide here and then reach out if you’d like to schedule a consultation.