I get asked this question a lot and figured it was time for mid-year check in. I ran these two reports for single-family homes in Park City (84060) and Snyderville Basin (84098) combined. This area is what I refer to as “Park City Mailbox” and this area makes up the Park City School District.

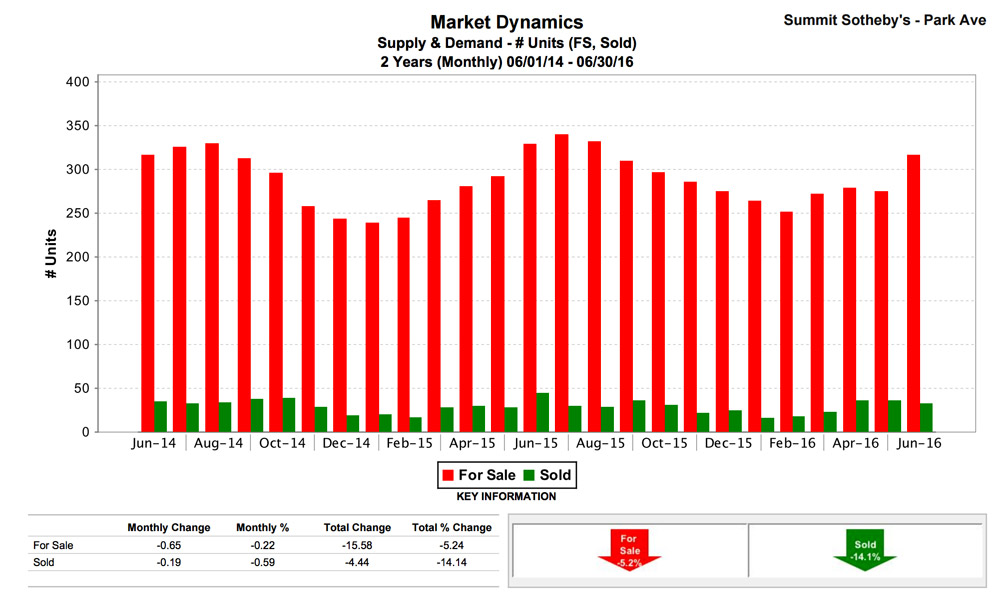
The first chart above shows the number of homes for sale vs number sold over the past two years. While our supply has gone down 5.2% during this time, the number of properties sold has decreased 14.1%.

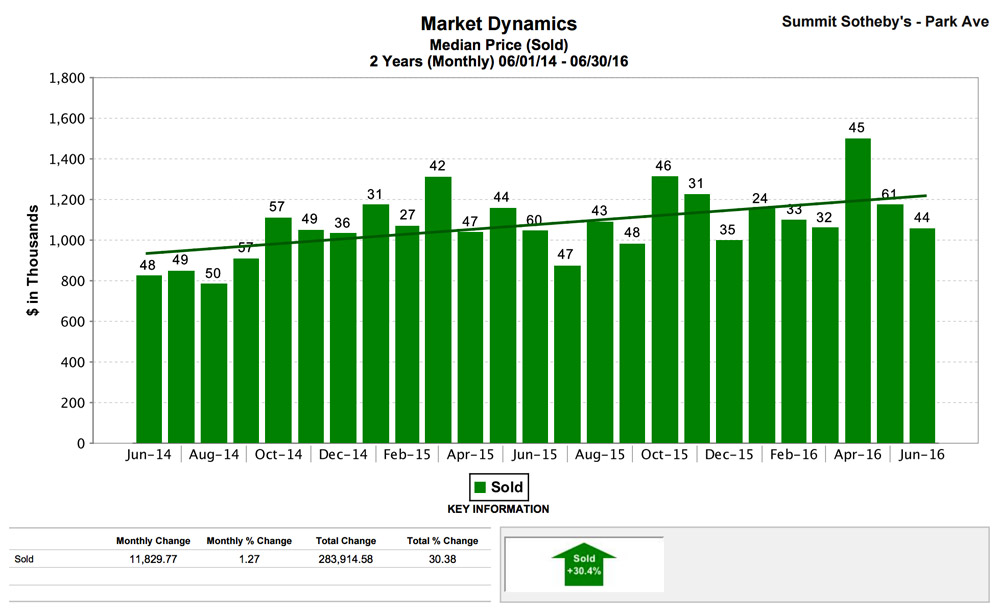
The next chart (above) shows that the median sale price has increased 30.4% during the same time period.
What do these Park City Real Estate Market insights mean?
These charts tell me a few things. Lower inventory has created pressure for increased prices and decreased number of sales. It is my opinion that the aggressive pricing of some homes has also caused sales to decrease and priced some buyers out of our market.
The little numbers at the top of the chart with the green bars are the number of homes sold each month. Although the number of sales is trending down over the two-year period, we had a very strong second quarter this year.
The Park City real estate market is very segmented, which is not shown on these charts. For example, in Jeremy Ranch, where I live, the number of sold homes increased by 29.2%. In Park Meadows, the number of sold homes decreased by 42.6% while the median price increased over 43%.
In answer to the question “How is the Park City Real Estate Market?” I would answer that inventory is down, prices are up and the market is highly segmented by neighborhood. What are your thoughts?