The Park City real estate market had a stellar performance last year; 2025 was one of the most robust markets Park City has ever experienced from a sold dollar volume perspective, second only to 2021. It was clear that there was a shift in both buyer and seller behavior last year and the data paints an intriguing picture. Demand remains solid, inventory is still below historical levels, and mortgage rates surprisingly dipped below 6%, all leading me to remain confident of a strong 2026 market.
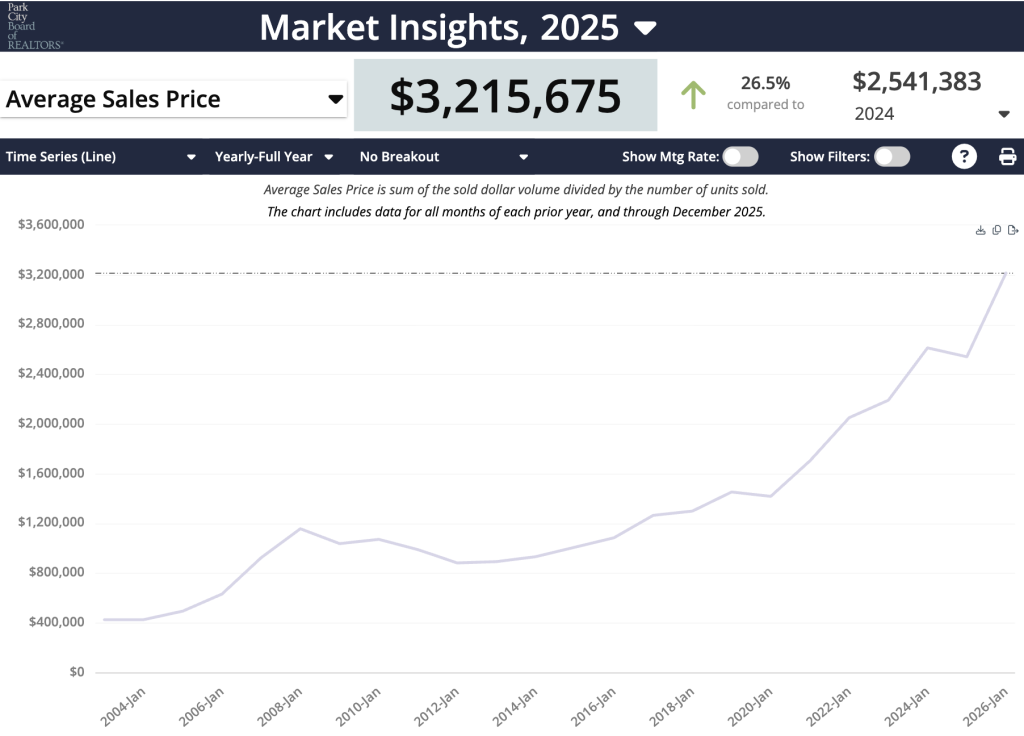
In my review of the data, one of the most compelling items I came across was the total sales volume for the Park City market: $3,270,341,034. This was an increase of 36.6% over 2024 and was only bested by 2021, when total sales volumes were just over $3.5B. This shows the Park City market is resilient, despite economic ups and the media’s non-stop negative coverage. It is remarkable to note that the sales volume between 2021 and 2025 was almost the same, yet the number of properties sold in 2025 was 1,025 versus 1,728 in 2021.
Looking at the price distribution for 2025, it is clear that the price points in Park City have steadily climbed since 2021.
Price Distribution – Closed Sales
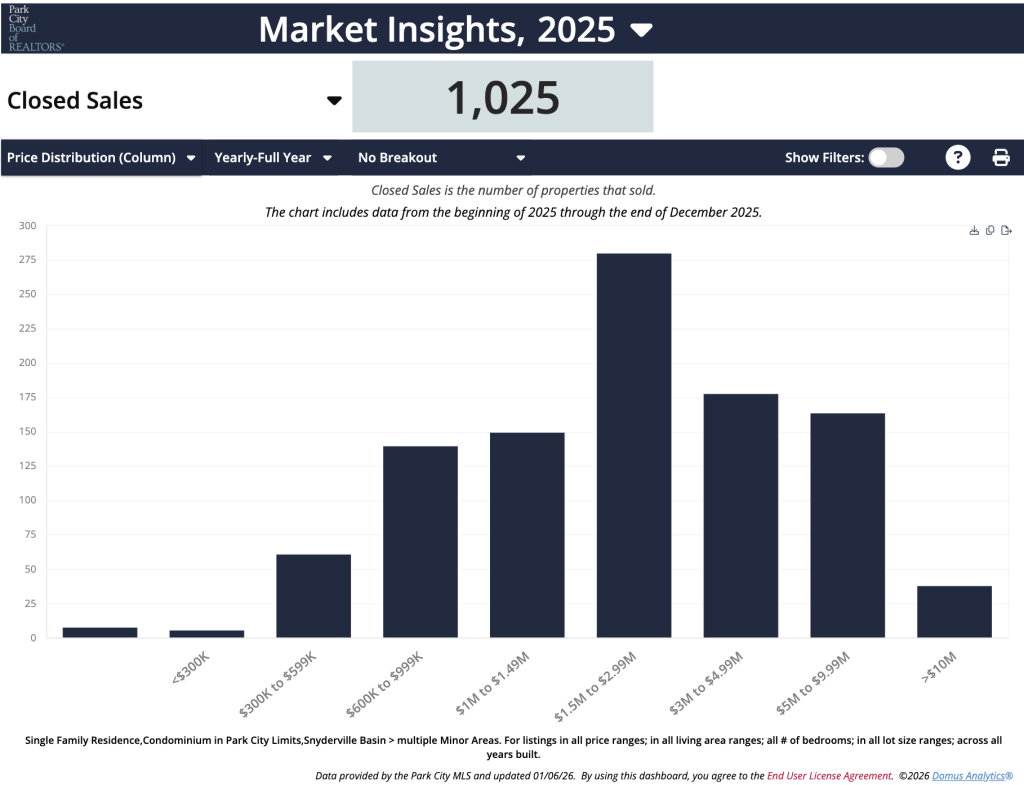
While the average and median sales prices have consistently been on a positive trend over the years, the distribution of sales in the luxury and ultra luxury segment have increased significantly. 2025 saw an explosion in that market, with a massive jump in properties that sold for $5M or greater. Most importantly, this data does not include the new Deer Valley East Village, as it is outside the geographic boundaries that define the “Park City” market and therefore doesn’t count towards totals. It is clear that the ripple effects of that development are being felt market-wide.
Percent of Total Properties Sold $5m+
- 2025 – 19.7%
- 2024 – 12%
- 2023 – 11%
- 2022 – 7.6%
- 2021 – 7.2%
To illustrate this upward momentum, let’s look at the largest pricing segment from 2021, which was $300k-$1.5m. 51% of properties sold fell into this bucket. In 2025, the largest pricing segment was $3m+, accounting for 37.1% of sold properties. The top end of the market has certainly been the most active segment over the last two years, as high interest rates combined with a hot stock market resulted in luxury buyers using their cash gains to diversify into real estate. Legacy properties priced at $10m or higher in Deer Valley, the Colony, and Promontory were the beneficiaries of this market!
Average Sales Price
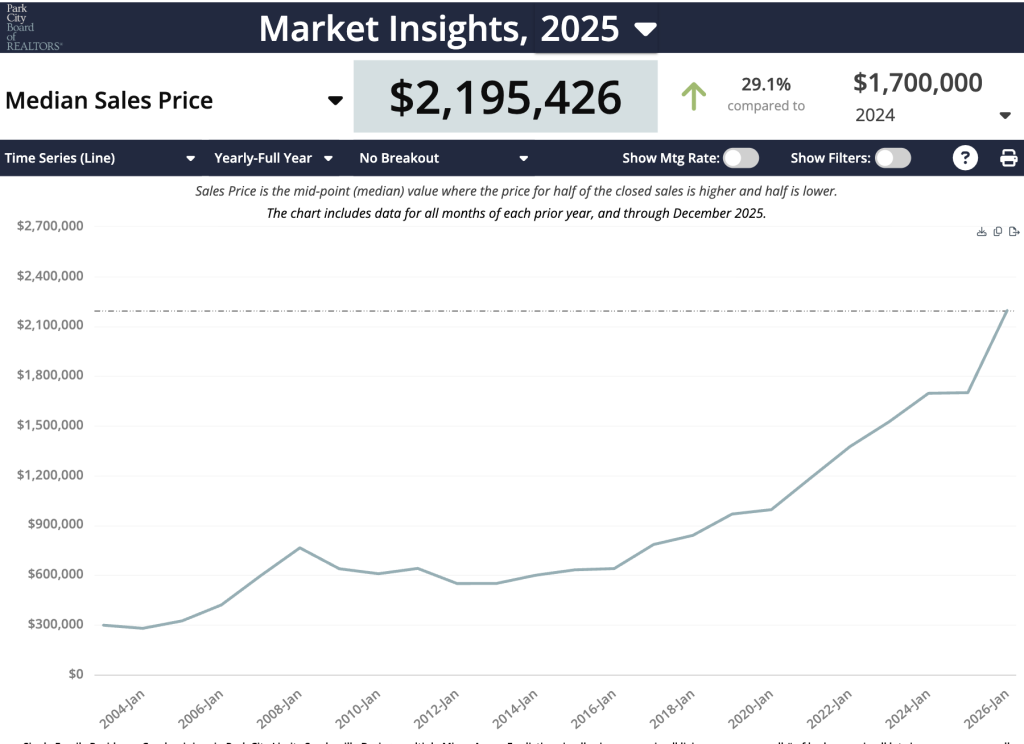
Median Sales Price
Park City’s Single-Family Home Market
I want to zoom in a bit on the market and look specifically at the performance of Single-Family Homes in the Park City market and then highlight a few key neighborhoods.
- Median Price: $2,829,600 – This was flat year over year.
- Average Price: $4,056,094 – This was a 13% increase over 2024.
- Closed Sales: 512 – This was a 16.4% increase over 2024, and is consistent with historical averages from 2012-2020.
- % Of Original Sales Price Received: 94.5% – This was an improvement from 91.9% in 2024.
- New Listings: 757 – This was flat year over year.
The Park City market has been split in two since 2022 after we hit the peak and the buyer frenzy subsided. New construction and “like” new construction (think full renovations and turn-key properties) have continued a nice run of appreciation and consistent demand. Properties that have become functionally obsolete – needing work, on a difficult lot, or an outlier property – began to lag the rest of the market and needed to be priced as a value proposition to generate demand.
Buyer and seller behavior have taken a few years to adjust to the new market reality. The sell-to-list ratio for 2025 was a marked improvement over 2024, meaning sellers were pricing their listings closer to what buyers were willing to pay, and days on market shrank by 25%, meaning homes were selling quicker. I anticipate that 2026 will put us back on track to hit historical trends in those figures. Take a look at specific neighborhoods below.
Park Meadows
Both the median (-2.3%) and average price (-5.2%) were down, however nearly 40% more homes sold than in 2024 even with new listings being on par with 2024. Park Meadows is one of the most consistent neighborhoods in Park City, and while there were outliers on the low and high end, it largely performed in line with expectations.
Silver Springs
Both the median (+9.5%) and average price (+11.4%) were up; however, there were 37.5% fewer sales and 28.2% fewer homes listed. Buyers searching for their home in Silver Springs were likely surprised to see less choice and higher prices, and with less to choose from, pricing tends to stay stronger. It also shows the desirability of one of Park City’s most underrated neighborhoods.
Pinebrook
Both the median (+8.9%) and average price (+6.8%) were up; however, there were 19.4% fewer sales and 22.8% fewer homes listed. Like Silver Springs, when faced with less selection, pricing stays strong.
Jeremy Ranch
Both the median (+11.8%) and average price (+1%) were up; however, the median increased significantly while the average ticked up one point, illustrating how much the middle has come up. Sold homes increased by 5% and there was an increase of 26% in homes listed. Jeremy Ranch has a strong market and pull for both Salt Lake City and Park City, and relatively speakin,g was one of the more popular places for a buyer to purchase a home.
Promontory
Both the median (-1.1%) and average price (-3.2%) were down. Sold homes in Promontory account for 27% of the total sold volume in the Park City market, exhibiting the sheer size of the Promontory market. An interesting metric for the neighborhood is that 25% of the properties that closed in 2025 went under contract in 2024 or earlier, because they were sold as pre-construction, developer-built homes priced one or more years ago. In addition to the dated contracts, 32% of the sold properties included the Double Deer Cottages and the new Villas that had completed construction. The Cottages price point is $2m and under, while the Villas were largely around the $3m mark. Between these two segments, I think the average and median price points have been skewed downward. Sold homes increased 34.9% and new homes listed increased 16%. Promontory continues to be the top “neighborhood” by both unit sales and sold dollar volume, and likely will be in that position for years to come.
Combined Park City Q4 Numbers & 2026 Q1 Outlook
Here is a brief highlight of the combined (Single Family, Townhomes, and Condominiums) Q4 numbers to know in the Park City market.
- Median Sales Price: $1,997,500 – This is a 21.2% increase from Q4 2024.
- Average Sales Price: $3,173,166 – This is a 21.7% increase from Q4 2024.
- Closed Sales: 284 – This is a 1.8% increase from Q4 2024, and an important note, the price distribution of these closed sales was relatively even, with neither the low or high skewing higher.
- New Listings: 314 – This is a 10.2% increase from Q4 2024.
Inventory is healing, the market is beginning to breathe again, and we are getting closer to historical averages regarding how many properties are being listed and sold annually, which ought to bring about stabilization. We are moving into the time of year when the resort marketplace becomes very active, with all signs indicating Q1 of 2026 will continue the trend of being one of the strongest times in our marketplace.
If we can pair continuing economic growth and lower interest rates, I expect to see a strong and consistent market in 2026. Each year brings challenges; however, those tend to cycle and given the uphill battles from high interest rates, political instability, market volatility, and consumer sentiment faced in 2023, 2024, and 2025 this coming year could be a breakout year as we find those conditions turn more favorable resulting in buyers finally getting off the sidelines, folks breaking out of their golden handcuffs (low Covid era interest rates) and moving on, and the continued generational transfer of wealth.
2 Comments
Great insights into the role of stablecoins in finance.
Great post! The article clearly summarizes the 2025 year‑end Park City real estate market trends and key insights.
https://www.gradsiren.co.in/state-cities/Andhra-Pradesh-state-AP?type=Jobs