In a resort marketplace, seasonality impacts not only tourism but also real estate. In Park City, we have two main seasons. The first, winter, corresponds to the ski season – which ramps up in mid-December and closes in mid-April. For investment property owners, this is the golden period, typically generating 80% of annual revenue.
The second season is summer, which is our hidden gem. Summer, starting in late June, is idyllic and often can be the deciding factor in people relocating here. The period from mid-April to late June is known as “mud season” due to spring runoff making hiking and biking trails muddy. During this time, many restaurants and shops close briefly, and the town quiets down. This context is essential when reviewing Q2 real estate data. With most of Q2 falling in “mud season,” it’s important to understand the data’s context. Since 2020, seasonality hasn’t been as evident, but the latest data shows it’s back. Let’s dive in.
Greater Park City Area Data Breakdown
- Median Sales Price: $1.79M, up 7.5% from Q1
- Average Sales Price: $2.56M, down 5.2% from Q1
- Closed Sales: 231, up 31.3% from Q1 and 9.5% from the same quarter last year
- Sold Dollar Volume: $591M, up 25% from Q1 and 6.6% from the same quarter last year
- Pended Properties: 229, down 14.2% from Q1 but up 6.5% from the same quarter last year
- Properties Listed This Quarter: 430, up 20.1% from Q1 and 11.7% from the same quarter last year
Key Indicators of Returning Seasonality
Pended Properties
Despite a Q1 dip, we are ahead compared to 2023. April and June accounted for 81% of total pended properties, which aligns with our market’s slowdown in mid-April and pickup in mid-June. This trend should be expected rather than seen negatively.
Closed Sales
April accounted for 40% of Q2’s closed sales, with many properties going under contract during Q1. This illustrates the seasonality effect.
Properties Listed
Listings increased significantly, with June accounting for 42% of new listings. This follows the trend of waiting until the summer selling season.
Another factor from Q2 that I would like to point out is that pricing has remained remarkably consistent. When viewed over a long-term trendline both the average and median prices continue to drive up annually. While the more recent quarters have illustrated only modest growth, I think that continued appreciation in our real estate market shows the overall resiliency and demand for the quality of life and access to the outdoors offered by Park City.
Market Outlook
The Q2 numbers are promising, especially the data from late June as we head into the summer season. More listings and contracts contribute to a balanced market. Compared to 2023, our marketplace is performing well, with every major metric up, indicating increased buyer and seller participation. In my Q4 market report, I noted Park City had entered a bifurcated market. I found a key metric that makes this evident in Q2.

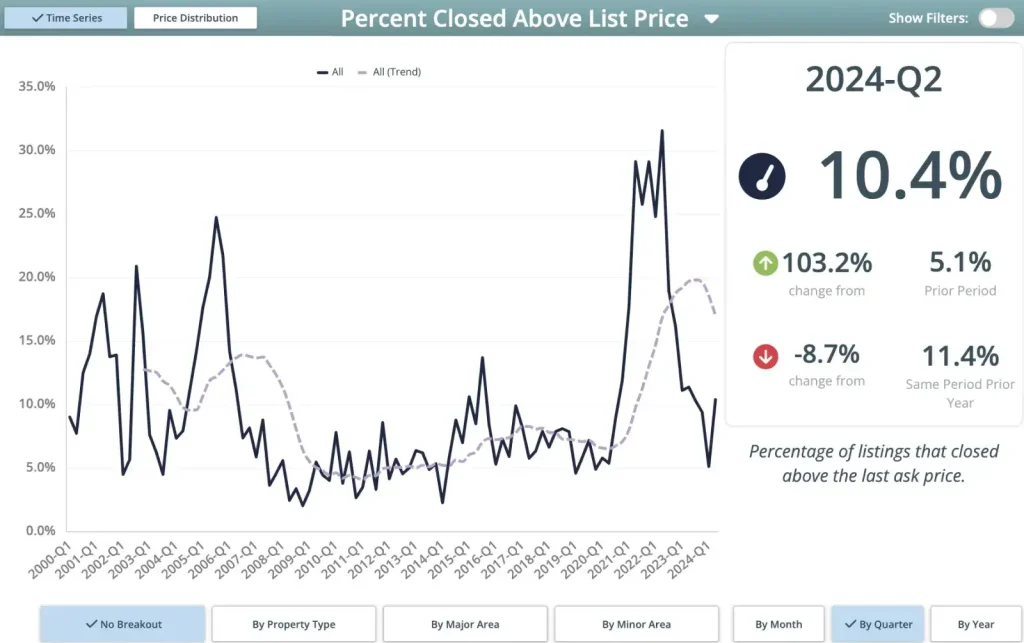
10.4% of properties sold over list price in Q2, despite the average list/sale price received being 96.3%. This is due to the high demand for turn-key properties, great locations, and new construction, which remain highly competitive. It’s crucial on both the buy and sell side to recognize which part of the market you are in, as strategies and transaction pace will vary.
Despite external factors, the Park City market remains resilient, with stable pricing and increasing transactions and inventory, pointing to a more consistent marketplace.
The robust contributions of June bode well for the summer and Q3. The past few years have seen unique market dynamics, but the return of seasonality may indicate a shift towards a more normalized market, which is excellent for Park City.
Want to dig further into the details or discuss specific neighborhoods? Reach out, and we can explore the details!